Report on an investigation as to the housing conditions, with a discussion on their correlation with the chief vital statistics and some notes on town planning / A. G. Anderson.
- Anderson, A. G.
- Date:
- 1911
Licence: In copyright
Credit: Report on an investigation as to the housing conditions, with a discussion on their correlation with the chief vital statistics and some notes on town planning / A. G. Anderson. Source: Wellcome Collection.
Provider: This material has been provided by London School of Hygiene & Tropical Medicine Library & Archives Service. The original may be consulted at London School of Hygiene & Tropical Medicine Library & Archives Service.
142/180 (page 120)
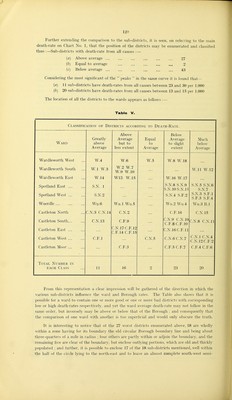
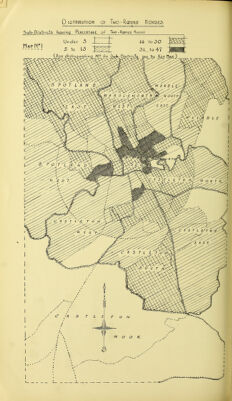
![Further extending the comparison to the sub-districts, it is seen, on referring to the main death-rate on Chart No. 1, that the position of the districts may be enumerated and classified thus :—Sub-districts with death-rate from all causes :— (fl) Above average ... ... ... ... ... ... 27 [h) Equal to average 2 (c) Below average ... ... ... ... ... ... 43 Considering the most significant of the peaks in the same curve it is found that— [a] 11 sub-districts have death-rates from all causes between 23 and 30 per 1,000 {b) 20 sub-districts have death-rates from all causes between 13 and 15 per 1,000 The location of all the districts to the wards appears as follows :— Table V. Classific ATiON OF Districts according to Death-Rate. Ward Greatly above Average Above Average but to less extent Equal to Average Below Average to slight extent Much below Average Wardleworth West W.4 W.6 W.5 W.8 W.l8 Wardleworth South W.l W.3 W.2 W.7 W.9 W.IO W.ll W.l2 Wardleworth East W.14 W13. W.15 W.l6 W.l7 Spotland East ... Spotland West S.N. 1 S.N.2 S.N.8 S.N.9 S.N.lOS.N.ll S.N.4 S.F.2 S.N.5 S.N.6 S.N.7 S.N.3 S.F.I S.F.3 S.F.4 Wuerdle Wu.6 Wu.l Wu.5 Wu.2 Wu.4 Wu.3 B.l Castleton North C.N.3 C.N. 14 C.N.2 C.F.16 C.N. 15 Castleton South... Castleton East ... Castleton West ... C.N. 13 C.F.I C.F.9 C.N.17C.F.12 C.F.14 C.F.15 C.N.5 C.N.9 C.N. 10 C.F.8 C.F.IO C.N.16C.F.11 C.N.6C.N.7 C.N.8 C.N.I 1 C.N.I C.N.4 C.N.12C.F.2 Castleton Moor ... C.F.3 C.F.5 C.F.7 C.F.4 C.F.6 Total Number in EACH Class 11 16 2 23 20 From this representation a clear impression will be gathered of the direction in which the various sub-districts influence the ward and Borough rates. The Table also shows that it is possible for a ward to contain one or more good or one or more bad districts with corresponding low or high death-rates respectively, and yet the ward average death-rate may not follow in the same order, but inversely may be above or below that of the Borough ; and consequently that the comparison of one ward with another is too superficial and would only obscure the truth. It is interesting to notice that of the 27 worst districts enumerated above, 18 are wholly within a zone having for its boundary the old circular Borough boundary line and being about three-quarters of a mile in radius ; four others are partly within or adjoin the boundary, and the remaining five are clear of the boundary, but enclose outlying portions, which are old and thickly populated ; and further, it is possible to enclose 17 of the 18 sub-districts mentioned, well within the half of the circle lying to the north-east and to leave an almost complete south-west semi-](https://iiif.wellcomecollection.org/image/b21364308_0142.jp2/full/800%2C/0/default.jpg)