[Report 1962] / Medical Officer of Health, Ince-in-Makerfield U.D.C.
- Ince-in-Makerfield (England). Urban District Council.
- Date:
- 1962
Licence: Attribution 4.0 International (CC BY 4.0)
Credit: [Report 1962] / Medical Officer of Health, Ince-in-Makerfield U.D.C. Source: Wellcome Collection.
8/32 page 6
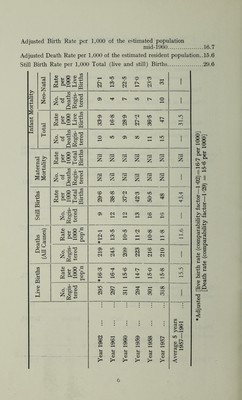
![Adjusted Birth Rate per 1,000 of the estimated population mid-1960 16.7 Adjusted Death Rate per 1,000 of the estimated resident population.. 15.6 Still Birth Rate per 1,000 Total (live and still) Births 29.6 Infant Mortality Neo-Natal Rate per 1000 Live Births 27T 13-5 22-5 17-0 23*3 31 1 No. of Deaths Regis- tered 9 4 7 5 7 10 1 Total Rate per 1000 Live Births 33-9 16-8 28-9 27*2 36*5 47 31.5 No. of Deaths Regis- tered o oo f-< m 1 Maternal Mortality Rate per 1000 Total Births Nil Nil Nil Nil Nil Nil 1 2 No. of Deaths Regis- tered 2 2 2 2 2 2 1 Still Births Rate per 1000 Total Births i 29*6 38-8 37-2 42*3 50*5 48 — 1 43.4 No. Regis- tered G) C<1 CO CO CD r—< t-H r-H ?— Deaths (All Causes) Rate per 1000 pop’n 1 *12-1 13-5 10- 5 11- 2 10-8 11*8 'sO No. Regis- tered i 219 245 209 223 216 210 1 i Live Births Rate per 1000 pop’n |*16-3 1 16-4 15-6 14- 7 15- 0 15-8 1 l No. Regis- tered 295 297 311 294 301 318 i • • • • : CO l-l 1-4 ..... i oj CD S? G> >>r-4 1 O G> 00 o UO 1 CD CD CD m lO m G) G) G) Gi G) G> T—« T—< W* T—« SPOi H t-< Vh U U i-1 rt aj o3 oj aJ rt <u - «• ~ — * • ——— 4) - 4> 4) 4) 4) 4) > >“• >4 >4 >4 >4 c Adjusted [live birth rate (comparability factor—1*02) = 16-7 per 1000] [Death rate (comparability factor—1*29) = 15*6 per 1000]](https://iiif.wellcomecollection.org/image/b29495544_0008.jp2/full/800%2C/0/default.jpg)