Annual report of the Director of Public Health of the United Provinces of Agra and Oudh.
- United Provinces of Agra and Oudh (India). Public Health Department
- Date:
- [1932]
Licence: Public Domain Mark
Credit: Annual report of the Director of Public Health of the United Provinces of Agra and Oudh. Source: Wellcome Collection.
184/206 page 64
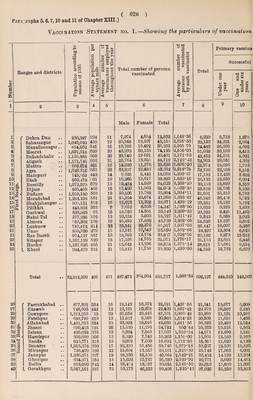
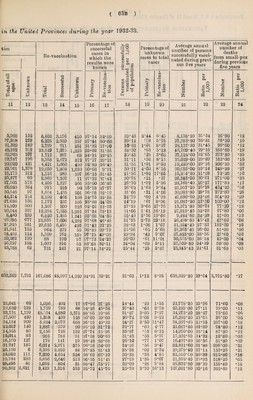
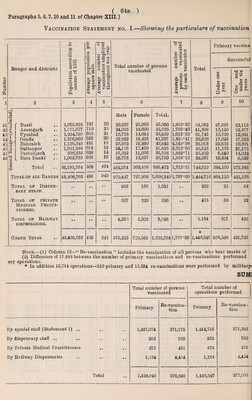
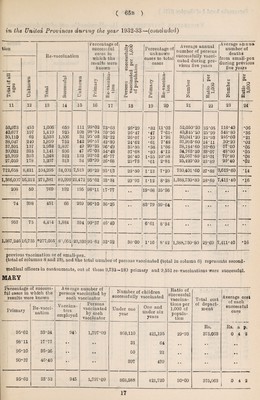
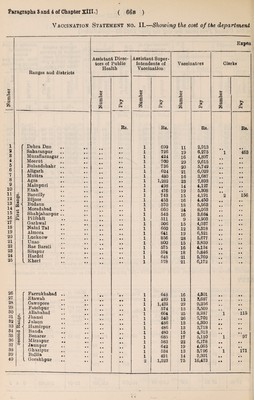
![Paragraphs 5, 6, 7,10 and 11 of Chapter XIII ] Vaccination Statement no. I.—Showiny the particulars of vaccination J-t © B £ 1 11 12 48 11 45 45 47 48 Ranges and districts Population according to census of 1931 Average population per square mile Average number of vaccinators employed throughout the year Total number of persons vaccinated Average number of persons vaccinated by each vaccinator Total - Primary vaccina Successful © d o w <u J-» c3 a ^ M Co W CO © w 2 a o O 3 2 3 4 5 6 7 8 9 10 ■a « f Basti § Azamgarh y Fyzabad i , Gonda ^ | Bahraich eg Sultanpur ^ Partabgarh ^ ^ Bara Banki o ^ Total Total op all Ranges Total op Dispen¬ sary stapp. Total op private Medical Practi¬ tioners. Total op Railway dispensaries. Grand Total 2,078,024 1,571,577 1,204,789 1,576,003 1.136,348 1,051,284 906,233 1,063,779 737 710 699 555 431 614 628 606 30 25 21 29 19 18 14 16 Male 29,937 24,035 19,775 22,902 23,962 24,156 15,322 16,773 Female 25,963 18,600 14,084 18,435 16,880 17,469 11,036 12,957 Total. 55,900 42,635 33,859 11,337 40,842 41,625 26,358 29,730 1,863*33 1,705*40 1,612*33 1,425*41 2,149*58 2,312*50 1,882*71 1,858-12 54,962 41,308 31,745 39,636 88,013 40,543 25,410 28,967 27,687 13,120 15,709 17,045 20,652 11,135 6,440 16,824 22,115 22,377 10,901 17,223 10,301 21,175 11,022 8,529 26,195,761 505 494 482,974 363,498 846,472 1,713-51 748,519 381,100 272,388 18,408,763 456 945 970,447 727,802 1,698,249 1,797*09 1,444,716 868,110 421,195 • • • • • • 895 136 1,031 • • 262 31 64 • • • * • • 597 329 926 • • 475 50 22 • • • • • • 4,283 1,302 5,588 • • 1,134 397 439 48,408,763 456 945 976,225 729,569 1,705,794 1,797-09 * 1,446,587 868,588 421,720 Note.—(1) Column 13—“ Re-vaccination ” includes the vaccination of all persons who bear marks of (2) Difference of 17,818 between the number of primary vaccinations and re-vaccinations performed ary operations. * In addition 15,711 operations—210 primary and 15,531 re-vaccinations were performed by military SUJYD Total number of persons vaccinated Total number of operations performed Primary Re-vaccina¬ tion Primary Re-vaccina- tion By special staff (Statement I) .. By dispensary staff .. By Private Medical Practitioners By Railway Dispensarios 1,427,074 262 475 1,134 271,175 769 451 4,454 1,444,716 262 475 1,134 271,381 769 451 4,454 1 . . .. . 1 > j](https://iiif.wellcomecollection.org/image/b31404959_0184.jp2/full/800%2C/0/default.jpg)