Medical Officer's annual report [to] Durban Corporation.
- Durban (South Africa). Public Health Department
- Date:
- [1962]
Licence: Public Domain Mark
Credit: Medical Officer's annual report [to] Durban Corporation. Source: Wellcome Collection.
9/110 (page 5)
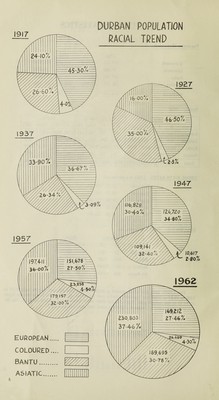
![II VITAL STATISTICS Population (Estimated) 1962 1961 Europeans 169,212 (27.46%) 166,116 (27.56%) Coloureds 26,480 (4.30%) 25,640 (4.25%) Bantu 189,695 (30,78%) 186,863 (31.00%) Asiatics 230,803 (37.46%) 224,227 (37.19%) All Races 616,190 602,846 Births: 1962 LEGITIMATE ILLEGITIMATE TOTALS Race M F Total 1961 M F Total 196] M F Total 1961 European 1680 1626 3306 3109 38 58 96 117 1718 1684 3402 3226 Coloured 465 470 935 941 137 139 276 232 602 609 1211 1173 Bantu 1658 1724 3382 2197 1847 1694 3541 3782 3505 3418 6923 5979 Asiatic 3712 3925 7637 7202 70 75 145 110 3782 4000 7782 7312 Total 7515 7745 15260 13449 2092 1966 4058 4241 9607 9711 19318 17690 CRUDE BIRTH RATES: (1961 in parenthesis) European 20.10 (19.42) Coloured 45.73 (45.75) Bantu 36.50 (32.00) Asiatic 33.72 (32.61) All Races 31.35 (29.34) STILLBIRTHS: (1961 in parenthesis) Number Rates European 23 (30 6.76 (9.30) Coloured 22 (22) 18.17 (18.76) Bantu 236 (222) 34.09 (37.13) Asiatic 169 (158) 21.72 (21.61) All Races 450 (432) 23.29 (24.42) The Asiatic birth rate which showed a steady decline over the past decade from 44.62 in 1950 to 28.57 in 1959, has improved slightly over the following three years to the present figure of 33.72 in the current year. Rates for the other races have remained fairly constant. The de¬ crease in the number of European stillbirths noted last year, has continued.](https://iiif.wellcomecollection.org/image/b3148699x_0009.jp2/full/800%2C/0/default.jpg)