Report of the Medical Officer of Health / Municipality of Colombo.
- Colombo (Sri Lanka). Public Health Department
- Date:
- [1928]
Licence: Public Domain Mark
Credit: Report of the Medical Officer of Health / Municipality of Colombo. Source: Wellcome Collection.
139/142 page 96
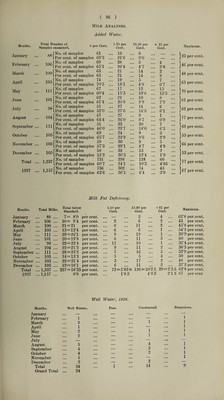
![Milk Analyses. Added Water. Months. Total Number of „_, Samples examined. ^er en * 1-10 per Cent. 11-30 per Cent. + 31 per Cent. January 88] No. of samples Per cent, of samples 61 69'3 • • • • • • 19 21*6 • • • • • • 8 9*0 — ::: } February ... 106] No. of samples Per cent, of samples 69 65*1 • • • • • • 28 26*4 • • • 5 4*7 4 3*8 ::: 1 March ... 100] No. of samples Per cent, of samples 63 63 • • • • • • 21 21 • • • • • • 14 14 2 2 ::: } April ... 105- No. of samples kPer cent, of samples 74 70*5 • • • 19 187 • • • • • • 5 4*8 7 6*7 ::: } May ... m: No. of samples Per cent, of samples 67 60‘4 • • • 17 15’3 • • • • • • 12 10*8 15 13*5 ::: } June ... 101- No. of samples 62 • • • 21 • • • 10 8 ... \ Per cent, of samples 61*4 • • • 20'8 • • • 9*9 7*9 July 98- No. of samples 51 • • • 27 • • • 14 6 ... \ Per cent, of samples 52*0 • • • 27*6 • • • 14*3 6*1 ... i August ... 104- No. of samples Per cent, of samples 67 64*4 • • • • • • 27 26'0 • • • • • • 9 8*7 1 0*9 ::: } September ... in- No. of samples ,Per cent, of samples 51 46*0 • • • 33 297 • • • 20 18*0 7 6*3 ::: } October ... 105 No. of samples .Per cent, of samples 69 657 • • • • • • 24 22*9 • • • • • • 9 8*6 3 2*9 ::: } November ... 103 No. of samples .Per cent, of samples 59 57*3 • • • • • • 30 29*1 • • • • • • 9 8*7 5 4*9 ::: } December ... 105 No. of samples .Per cent, of samples 58 55*2 • • • • • • 32 30*5 • • • • • • 13 12*4 2 1*9 ::: } Total ... 1,237- [No. of samples 751 • • • 298 • • • 128 60 ... \ [Per cent, of samples 607 • • • 24*1 • • • 10*3 4*85 ... ) 1927 ... 1,157- [No. of samples 736 • • • 302 • • • 74 45 ... 1 [Per cent, of samples 63’6 • • • 26*1 • • • 6*4 3*9 ... J Maximum. 23 per cent. 46 per cent. 48 per cent. 65 per cent. 70 per cent. 61 per cent. 62 per cent. 77 per cent. 69 per cent. 53 per cent. 66 per cent. 53 per cent. 77 per cent. 67 per cent. Milk Fat Deficiency. Months. Total Milks. Total below Standard. 1-10 per 11-30 per Cent. Cent. + 31 per Cent. Maximum. January ... 88 • • • 7= 8*0 per cent. • • • • • • 3 4 ... 62*8 per cent. February ... 106 • • • 10= 9*4 per cent. ... 2 6 2 ... 43 per cent. March ... 100 • • • 21=21 per cent. ... 8 11 2 ... 45*8 per cent. April ... 105 • • • 13=12*4 per cent. ... 6 6 1 ... 54*2 per cent. May ... Ill • • • 29=26*1 per cent. ... 9 19 1 ... 39*9 per cent. June ... 101 20=19*8 per cent. ... 6 11 3 ... 60 per cent. July ... 98 • • • 22=22*4 per cent. ... 11 10 1 ... 31*4 per cent. August ... 104 • • • 22=21*2 per cent. ... 9 11 2 38*5 per cent. September ... Ill • • • 28=25*2 per cent. ... 7 16 5 52*9 per cent. October ... 105 • • • 14=13*3 per cent. 5 5 4 ... 50 per cent. November ... 103 • • • 22 = 21*4 per cent. ... 3 17 2 ... 48 per cent. December ... 105 ... 19 = 18*1 per cent. ... 6 11 2 ... 37*2 per cent. Total ... 1,237 ... 227 = 18*35 per cent. ... 72=5*82% 126 = 10*2$ 29=2*3$ 62*8 per cent. 1927 ... 1,157 ... 8*8 per cent. 1*8# 4*8$ 2*1$ 67 percent Months. January February March April May June July August September October November December Total Grand Total Well Water, 1928. Well Waters. Pass. 1 2 1 2 2 5 4 4 1 2 24 24 1 Condemned. 1 1 1 4 3 2 2 14 Suspicious. 1 1 1 1 1 1 1 1 1 9](https://iiif.wellcomecollection.org/image/b31495278_0139.jp2/full/800%2C/0/default.jpg)