Annual report on the health and medical services of the state of Queensland.
- Queensland. Department of Health.
- Date:
- [1966]
Licence: Public Domain Mark
Credit: Annual report on the health and medical services of the state of Queensland. Source: Wellcome Collection.
7/88 (page 5)
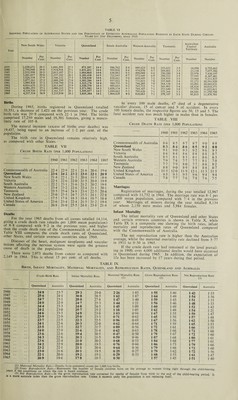
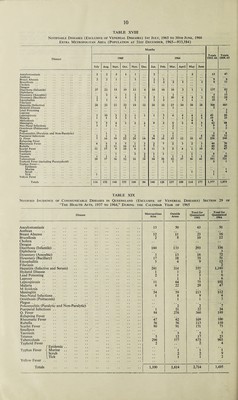
![TABLE VI Showing Population of Australian States and the Percentage of Estimated Australian Population Resident in Each State During Certain Years (at 31st December), since 1935 Year New South Wales Victoria Queensland South Australia Western Australia Tasmania Australian Capital Territory Australia Number Per Cent. Number Per Cent. Number Per Cent. Number Per Cent. Number Per Cent. Number Per Cent. Number Number 1935 .. 2,658,672 39-3 1,841,595 27-3 971,297 144 586,762 8-4 449,623 6 6 233,623 3-5 14,890 6 755 662 1940 .. 2,790,948 39-4 1,914,918 27-1 1,031,452 14 6 599,056 8-4 474,076 6-7 244,002 3-5 23 134 7 077 586 1945 2,932,998 39-5 2,015,107 27-1 1,084,864 14 6 630,882 8-5 490,088 6-6 250,280 3-4 25 978 7 430197 1950 3,241,057 390 2,237,182 281 1,205,418 14 5 722,843 8-7 572,649 6-9 290,333 3-5 37 999 8 307 481 1955 3,526,534 37-9 2,546,332 27-3 1,358,858 14 6 834,661 9 0 668,609 7-2 324,919 3-5 33 960 9 31 1 825 1960 3,877,261 37-3 2,888,290 27-8 1,502,286 14 5 957,022 9-2 731,033 70 355,969 3-4 55’272 10 391920 1961 3,949,420 37-2 2,950,790 27-8 1,525.278 14 4 980,755 9-2 746,205 7-0 364,134 3-4 62 091 10 603 931 1962 4,016,635 37-2 3,013,447 27-9 1,550,370 14 3 999,693 9-2 765,715 71 369,403 3-4 68 824 10 810 371 1963 4,086,293 371 3,080,215 27-9 1,571,982 14 3 1,020,174 9-3 784,107 71 373,640 3-4 77 578 1 1 ^022^81 1 1964 4,158,926 370 3,161,537 281 1,595,057 14 2 1,044,662 9-3 799,626 71 375,268 3-3 84 686 1 1 250 708 1965 4,237,514 36-9 3,233,938 28-2 1,615,384 14 1 1,064,629 9 3 820,063 7-1 379,107 3-3 93,815 ll’478]703 Births During 1965, births registered in Queensland totalled 33,551, a decrease of 1,421 on the previous year. The crude birth rate was 20-9 compared with 22-1 in 1964. The births comprised 17,250 males and 16,301 females, giving a mascu¬ linity rate of 105-8. The natural increase (excess of births over deaths) was 19,437, being equal to an increase of 1-2 per cent, of the population. The birth rate in Queensland remains relatively high, as compared with other States. TABLE VII Crude Birth Rate (per 1,000 Population) 1960 1961 1962 1963 1964 1965 Commonwealth of Australia 22-4 22-9 22-1 21-6 20-6 19-6 Queensland .. 23 6 24-2 23-2 230 22 1 20 9 New South Wales .. 21-4 22-1 21-5 20-8 19-5 18-6 Victoria 22-4 22-6 220 21-5 20-8 19-8 South Australia 22-2 23-1 21-6 21-2 20-2 19-8 Western Australia .. 23-4 23-2 22-6 22-4 211 20-1 Tasmania 25-5 25-4 24-8 23-4 22-5 20-4 New Zealand 250 25-5 24-7 25-5 24-1 22-8 United Kingdom .. 17-5 17-8 18-3 18-4 18-7 18-4 United States of America .. 23-6 23-4 22-4 21-5 21-2 19-4 Canada 26-8 26-0 25-5 24-8 23-8 21-4 Deaths For the year 1965 deaths from all causes totalled 14,114, giving a crude death rate (deaths per 1,000 mean population) of 8-8 compared with 9-2 in the previous year, and higher than the crude death rate of the Commonwealth of Australia. Table VIII compares the crude death rates of Queensland, other States, and certain overseas countries since 1960. Diseases of the heart, malignant neoplasms and vascular lesions affecting the nervous system were again the greatest cause of death in the population. There were 2,073 deaths from cancer as compared with 2,149 in 1964. This is about 15 per cent, of all deaths. In every 100 male deaths, 47 died of a degenerative vascular disease, 15 of cancer and 9 of accident. In every 100 female deaths, the respective figures are 50, 15 and 5. The fatal accident rate was much higher in males than in females. TABLE VIII Crude Death Rate (per 1,000 Population) 1960 1961 1962 1963 1964 1965 Commonwealth of Australia 8-6 8-5 8-7 8-7 9-0 8-8 Queensland .. 8-3 8 4 8 6 85 9 2 8 8 New South Wales .. 91 90 9-3 9-2 9-6 9 3 Victoria 8-6 8-4 8-6 8-8 8-8 8-7 South Australia 8-3 8-1 8-3 81 8-6 8-3 Western Australia . . 7-9 7-8 7-7 7-7 ' 8-1 7-8 Tasmania 7-7 7-9 80 7-7 8-6 8-2 New Zealand 8-8 9-0 8-9 8-8 8-8 8-7 United Kingdom .. 11-5 120 11-9 12-1 11-3 11-5 United States of America . 9-5 9-3 9-5 9-6 9.4 9.4 Canada .. 7-8 7-7 7-6 7-8 7-6 7-5 Marriages Registration of marriages, during the year totalled 12,967 compared with 11,752 in 1964. The marriage rate was 8-1 per 1,000 mean population, compared with 7-4 in the previous year. Marriages of minors during the year totalled 8,134 of whom 2,150 were males and 5,984 females. Infant Mortality The infant mortality rate of Queensland and other States and certain overseas countries is shown in Table X, while Table IX is a composite one showing the birth rates, infant mortality and reproduction rates of Queensland compared with the Commonwealth of Australia. The net reproduction rate is higher than the Australian average, whilst the maternal mortality rate declined from 5-77 in 1911 to 0-30 in 1965. If the crude death rate had remained at the level prevail¬ ing in 1900, over 4,000 additional deaths would have occurred in Queensland during 1965. In addition, the expectation of life has been increased by 17 years during that period. TABLE IX Birth, Infant Mortality, Maternal Mortality, and Reproduction Rates, Queensland and Australia — Crude Birth Rate Infant Mortality Rate Maternal Mortalitv Rate (t) Gross Reproduction Rate (2) Net Reproduction Rate (3) Queensland Australia Queensland Australia Queensland Australia Queensland Australia Queensland Australia 1946 .. 24-8 23-7 29 3 290 2-26 1-85 1 55 1-46 1 42 1-33 1947 .. 25 6 24-1 30 8 28-5 1 62 1-87 1 64 1-49 1 54 1-36 1948 .. 24-7 23-1 28 0 27-8 1 47 1-40 1 59 1-45 1 51 1-33 1949 .. 24 0 22-9 24-7 25-3 1 44 1-21 1 56 1-46 1 48 1-33 1950 .. 244 23-3 24-8 24-5 1 45 1-09 1 60 1-49 1 52 1-42 1951 .. 24 2 23-0 25-7 25-2 1 18 1-05 1 62 1-49 1 54 1-21 1952 .. 24 6 23-3 24 9 23-8 1 03 0-94 1 67 1-55 1 59 1-47 1953 .. 23 9 22-9 25 0 23-3 0-71 0-62 1 65 1-56 1-57 1-48 1954 .. 23-7 22-5 22-3 22-5 0 96 0-69 1 67 1-56 1 62 1-50 1955 .. 24 1 22-6 20-3 22-0 0 62 0-64 1 71 1-59 1 65 1-53 1956 .. 23-5 22-5 22-7 21-7 0 89 0-56 1-72 1-61 1 66 1-55 1957 .. 24 0 22-9 21 6 21-4 0 62 0-63 1-78 1-66 1-72 1-60 1958 .. 23 6 22-6 19 4 20-5 0-47 0-50 1 79 1-67 1-72 1 -60 1959 .. 243 22-6 20-3 21-5 0 59 0-46 1 87 1-68 1 80 1-61 I960 .. 23 6 22-4 21 0 20-2 0 68 0-53 1 84 1-68 1-77 1-61 1961 .. 242 22-9 20 0 19-5 076 0-44 1 86 1-73 1 79 1 -66 1962 .. 23-2 22-1 21 1 20-4 0 64 0-36 1 79 1*66 1-72 1-60 1963 .. 23 0 21-6 20 1 19-5 0-25 0-27 1 79 1-62 1-72 1-56 1964 .. 22 1 20-6 19 2 19-1 0 29 0-33 1 68 1-53 1 61 1-47 1965 20 9 19-6 178 18-5 0 30 1-57 1-45 1 51 1-40 (1) Maternal Mortality Rate.—Deaths from puerperal causes per 1,000 live births. (2) Gross Reproduction Rate.—Represents the number of female children born on the average to women living right through the child-bearing years if the conditions on which the rate is based continue. (3) Net Reproduction Rate.—Is the gross reproduction rate corrected for deaths of females from birth to the end of the child-bearing period, It is a more accurate index than the gross reproduction rate, Unless it exceeds unity the population is not replacing itself,](https://iiif.wellcomecollection.org/image/b31494286_0007.jp2/full/800%2C/0/default.jpg)