Report of the Health Officer, Corporation of Madras Health Department.
- Madras (India). Health Department
- Date:
- [1944]
Licence: Public Domain Mark
Credit: Report of the Health Officer, Corporation of Madras Health Department. Source: Wellcome Collection.
10/56 (page 2)
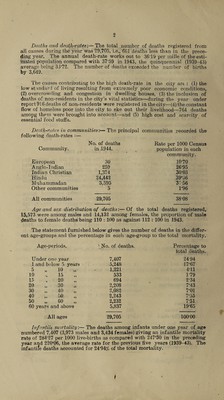
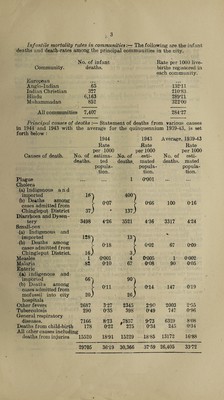
![x Deaths and death-rates:—The total number of deaths registered from all causes during the year was 29,705, i.e., 661 deaths less than in the prece¬ ding year. The annual death-rate works out to 3619 per mille of the esti¬ mated population compared with 37*59 in 1943, the quinquennial (1939-43) average being 33*72. The number of deaths exceeded the number of births by 3,649. The causes contributing to the high death-rate in the city are : (1) the low standard of living resulting from extremely poor economic conditions, (2) overcrowding and congestion in dwelling houses, (3) the inclusion of deaths of non-residents in the city’s vital statistics—during the year under report 916 deaths of non-residents were registered in the city—(4) the constant flow of homeless poor into the city to eke out their livelihood—764 deaths among them were brought into account—and (5) high cost and scarcity of essentia] food stuffs. Death-rate;s in communities:— The principal communities recorded the following death-rates :— No. of deaths Rate per 1000 Census Community. in 1944. population in each community. European 30 10*70 Anglo-Indian 259 26*95 Indian Christian 1,374 30-03 Hindu 24,442 39*36 Muhammadan 3,595 37-56 Other communities 5 1*96 All communities 29,705 38*08 Age and sex distribution of deaths:— Of the total deaths registered. 15,573 were among males and 14,132 among females, the proportion of male deaths to female deaths being 110 : 100 as against 112 : 100 in 1943. The statement furnished below gives the number of deaths in the differ- ent age-groups and the percentage in each age-group to the total mortality. Age-periods. 'No. of deaths. Percentage to total deaths. Under one year 7,407 24-94 1 and below 5 years 5,248 17*67 5 „ 10 „ - 1.221 4*11 10 „ 15 533 1*79 15 , 20 694 2*34 20 „ 30 2,208 7*43 30 „ 40 2,082 7*01 40 „ 50 „ 2,243 7*55 50 „ 60 „ 2,232 7*51 60 years and above 5,837 19-65 All ages 29,705 100*00 Infantile mortality:— The deaths among infants under one year of age numbered 7,407 (3,973 males and 3,434 females) giving an infantile mortality rate of 284*27 per 1000 live-births as compared with 247*30 in the preceding year and 220*06, the average rate for the previous five years (1939-43). The infantile deaths accounted for 24*94% of the total mortality.](https://iiif.wellcomecollection.org/image/b31484931_0010.jp2/full/800%2C/0/default.jpg)