Licence: In copyright
Credit: The chemistry of the radio-elements / by Frederick Soddy. Source: Wellcome Collection.
21/64 page 9
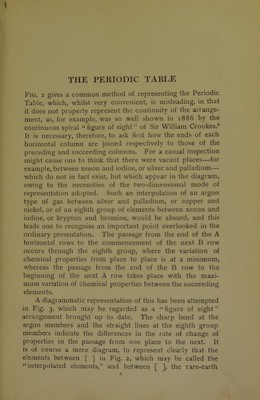
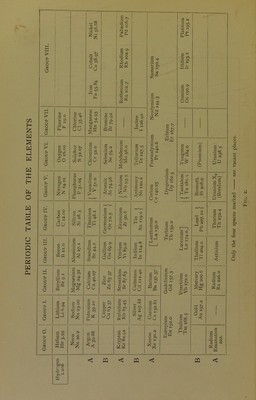
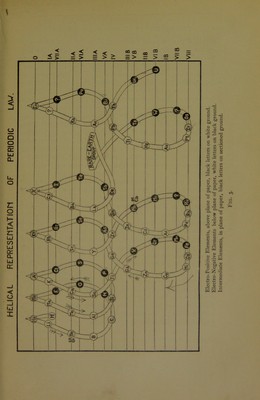
![THE PERIODIC TABLE Fig. 2 gives a common method of representing the Periodic Table, which, whilst very convenient, is misleading, in that it does not properly represent the continuity of the arrange- ment, as, for example, was so well shown in 1886 by the continuous spiral “ figure of eight'' of Sir William Crookes.® It is necessary, therefore, to ask first how the ends of each horizontal column are joined respectively to those of the preceding and succeeding columns. For a casual inspection might cause one to think that there were vacant places—for example, between xenon and iodine, or silver and palladium— which do not in fact exist, but which appear in the diagram, owing to the necessities of the two-dimensional mode of representation adopted. Such an interpolation of an argon type of gas between silver and palladium, or copper and nickel, or of an eighth group of elements between xenon and iodine, or krypton and bromine, would be absurd, and this leads one to recognise an important point overlooked in the ordinary presentation. The passage from the end of the A horizontal rows to the commencement of the next B row occurs through the eighth group, where the variation of chemical properties from place to place is at a minimum, whereas the passage from the end of the B row to the beginning of the next A row takes place with the maxi- mum variation of chemical properties between the succeeding elements. A diagrammatic representation of this has been attempted in Fig. 3, which may be regarded as a “ figure of eight arrangement brought up to date. The sharp bend at the argon members and the straight lines at the eighth group members indicate the differences in the rate of change of properties in the passage from one place to the next. It is of course a mere diagram, to represent clearly that the elements between | [ in Fig. 2, which may be called the “ interpolated elements, and between [ ], the rare-earth](https://iiif.wellcomecollection.org/image/b28061913_0021.jp2/full/800%2C/0/default.jpg)


 No text description is available for this image
 No text description is available for this image
 No text description is available for this image