Report of the surgical operations performed at the Newcastle-upon-Tyne Infirmary during a period of seventeen years and a half. Pt. 1, On amputations of the limbs / by Samuel Fenwick.
- Samuel Fenwick
- Date:
- 1848
Licence: Public Domain Mark
Credit: Report of the surgical operations performed at the Newcastle-upon-Tyne Infirmary during a period of seventeen years and a half. Pt. 1, On amputations of the limbs / by Samuel Fenwick. Source: Wellcome Collection.
57/64 (page 57)
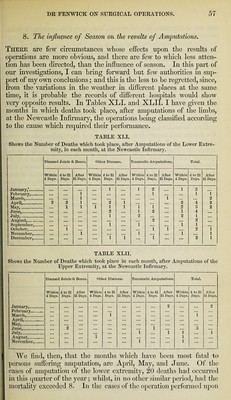
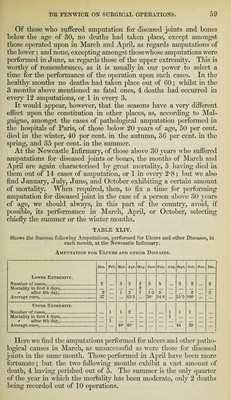
![8. The influence of Season on the results of Amputations. There are few circumstances whose effects upon the results of operations are more obvious, and there are few to which less atten¬ tion has been directed, than the influence of season. In this part of | our investigations, I can bring forward but few authorities in sup¬ port of my own conclusions; and this is the less to be regretted, since, from the variations in the weather in different places at the same time, it is probable the records of different hospitals would show very opposite results. In Tables XLI. and XLII. I have given the months in which deaths took place, after amputations of the limbs, at the Newcastle Infirmary, the operations being classified according to the cause which required their performance. TABLE XLI. i Shows the Number of Deaths which took place, after Amputations of the Lower Extre¬ mity, in each month, at the Newcastle Infirmary. Diseased Joints & Bones. Other Diseases. Traumatic Amputations. Total. Within 4 to 21 After Within 4 to 21 After Within 4 to 21 After Within 4 to 21 A fter 4 Days. Days. 21 Days, 4 Days. Days. 21 Days. 4 Days. Days. 21 Days. 4 Days. Days. 21 Days. January,'. • • • r« ■ • • • • • • 1 ... 1 2 ... 1 3 ... February,. ... ... 1 • •• ... ... ... 1 ... ... 1 1 March,. • •• • •• 1 ... ... ... ... ... 1 ... ... 2 April,. 2 2 1 • •• 2 1 ... ... ... 2 4 2 May,. • •• 1 1 1 1 1 1 1 ... 2 3 2 June,. • • • • •• • •• • •• 2 ... 1 2 ... 1 4 ... July,. • •• ... ... • • • I ... 2 ... ... 2 1 ... August,..... ... ... ... • • • ... ... 2 ... ... 2 ... September,. • •• ... • •• ... 1 1 ... ... 1 1 ... October,. • •• 1 ... • •• ... ... ... 1 1 ... 2 1 November,. • •• 1 • •• ... ... 1 ... ... 1 ... 1 December,. ... ••• ... 1 1 ... 1 ... ... 2 1 TABLE XLII. Shows the Number of Deaths which took place in each month, after Amputations of the Upper Extremity, at the Newcastle Infirmary. Diseased Joints & Bones. Other Diseases. Traumatic Amputations. Total. Within 4 to 21 After Within 4 to 21 After Within 4 to 21 After Within 4 to 21 After 4 Days. Days. 21 Days. 4 Days. Days. 21 Days. 4 Days. Days. 21 Days. 4 Days. Days. 21 Days. January,. ... ... ... ... ... ... ... 2 ... ... 2 February. ... ... ... ... ... ... ... ... ... ... March,. ... ... ... 1 ... • • • ... ... ... 1 ... April,. ... ... • •• ... ... ... ... ... ... ... ... May,. ... ... ... ... ... ... ... ... ... ... ... June,. 2 ... ... ... ... 1 ... ... 3 ... July,. ... ... ... 1 ... ] 1 ... 1 August,. ... ... 1 ... • •• ... ... ... 1 ... ... November,. ••• ... ... ••• ... • •• 1 ... ... 1 ... ... ) We find, then, that the months which have been most fatal to persons suffering amputation, are April, May, and June. Of the I cases of amputation of the lower extremity, 20 deaths had occurred in this quarter of the year; whilst, in no other similar period, had the mortality exceeded 8. In the cases of the operation performed upon](https://iiif.wellcomecollection.org/image/b30559959_0057.jp2/full/800%2C/0/default.jpg)