Licence: In copyright
Credit: Hygiene: a manual of personal and public health. Source: Wellcome Collection.
Provider: This material has been provided by London School of Hygiene & Tropical Medicine Library & Archives Service. The original may be consulted at London School of Hygiene & Tropical Medicine Library & Archives Service.
359/372 (page 347)
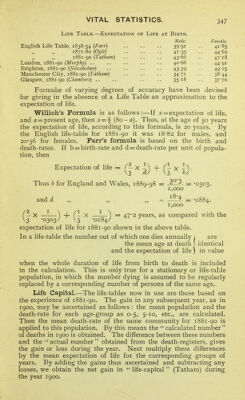
![Life Table.—Expectation of Life at Birth. English Life Table, 1838-54 [Farr] 1871-80 {Ogle) 1881-90 (Tatham) London, 1881-90 [Murphy) .. Brighton, 1881-90 {Neivsholme) Manchester City, 1881-90 [Tatham) Glasgow, 1881-90 [Chambers) .. Male. Female. 39- 91 .. 41-85 41-35 .. 44-62 43-66 .. 47-18 40- 66 . , 44'9i 43.59 . . 49-25 3471 • • 38-44 35-18 •• 37-70 Formulae of varying degrees of accuracy have been devised for giving in the absence of a Life Table an approximation to the expectation of life. Willich's Formula is as follows:—If = expectation of life, and a = present age, then x = ^ (^o- a). Thus, at the age of 50 years the expectation of life, according to this formula, is 20 years. By the English life-table for 1881-90 it was 18*82 for males, and 20-56 for females. Farr's formula is based on the birth and death-rates. If b = birth-rate and d = death-rate per unit of popula- tion, then Expectation of life = f^- x + X V3 dj V3 hj Thus for England and Wales, 1889-98 = ^ = -0303. 1,000 and d ,, ,, = _ -0884. 1,000 X ——\ 4- l^i X —=47*2 years, as compared with the \3 -0303^ ^3 -0184/ expectation of life for 1881-90 shown in the above table. In a life-table the number out of which one dies annually j are the mean age at death s identical and the expectation of life) in value when the whole duration of life from birth to death is included in the calculation. This is only true for a stationary or life-table population, in which the number dying is assumed to be regularly replaced by a corresponding number of persons of the same age. Life Capital.—The life-tables now in use are those based on the experience of 1881-90. The gain in any subsequent year, as in 1900, may be ascertained as follows : the mean population and the death-rate for each age-group as 0-5, 5-10, etc., are calculated. Then the mean death-rate of the same community for 1881-90 is applied to this population. By this means the calculated number of deaths in 1900 is obtained. The difference between these numbers and the actual number obtained from the death-registers, gives the gain or loss during the year. Next multiply these differences by the mean expectation of life for the corresponding groups of years. By adding the gains thus ascertained and subtracting any losses, we obtain the net gain in life-capital (Tatham) during the year 1900.](https://iiif.wellcomecollection.org/image/b21357675_0359.jp2/full/800%2C/0/default.jpg)