[Report 1904] / Medical Officer of Health, Salop / Shropshire County Council.
- Shropshire Council
- Date:
- 1904
Licence: Attribution 4.0 International (CC BY 4.0)
Credit: [Report 1904] / Medical Officer of Health, Salop / Shropshire County Council. Source: Wellcome Collection.
5/100 (page 5)
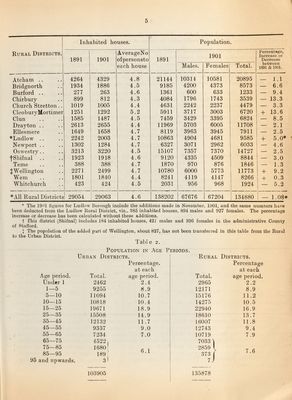
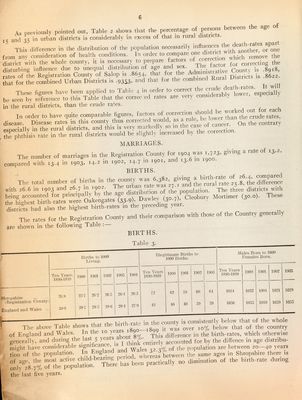
![Inhabited houses. Population. Rural Districts. AverageNo 1901 Percent ftgo, Increase or 1891 1901 ofpersonsto 1891 Decrease each house Males. Females Total. between 1891 & 1901. Atcliam .. 4264 4329 4.8 21144 10314 10581 20895 ___ 1.1 Bridgnorth 1934 1886 4.5 9185 4200 4373 8573 — 6.6 Burford .. 277 263 4.6 1361 600 633 1233 — 9.4 Chirbury 899 812 4.3 4084 1796 1743 3539 — 13.3 Church Stretton.. 1019 1005 4.4 4631 2242 2237 4479 — 3.3 CleohuryMortimer 1251 1292 5.2 5911 3717 3003 6720 + 13.6 Clun 1585 1487 4.5 7459 3429 3395 6824 — 8.5 Drayton .. 2613 2655 4.4 11969 5703 6005 11708 — 2.1 Ellesmere 1649 1658 4.7 8119 3963 3945 7911 — 2.5 *Ludlow .. 2242 2003 4.7 10863 4904 4681 9585 + 5.0* Newport .. 1.302 1284 4.7 6327 3071 2962 6033 — 4.6 Oswestry.. 3213 : 3220 4.5 15107 7357 7370 14727 — 2.5 f Shifnal 1923 1918 4.6 9120 4335 4509 8844 — 3.0 Teme 388 ! 388 4.7 1870 970 876 1846 — 1.3 JWellington 2271 i 2499 4.7 10780 6000 5773 11773 + 9.2 Wem 1801 1840 4.4 8241 4119 4147 8266 1 + 0.3 Whitchurch 423 424 4.5 2031 956 968 1924 1 1 5.2 *A11 Rural Districts 29054 ^ 29063 4.6 138202 67676 67204 134880 1 1.08=1 * The 19iU figures for Ludlow Borough include the additions made in November, 1901, and the same numbers have been deducted from the Ludlow liural District, viz., 385 inhabited houses, 894 males and 927 females. The percentage increase or decrease has been calculated without these additions. t This district (Shifnal) includes 184 inhabited houses, 42f males and 396 females in the administrative County of Stafford. J The population of the added part of Wellington, about 827, has not been transferred in this table from the Eural to the Urban Distiict. Tab] e 2. Population in Age Periods. Urban Districts. Rural Districts. Percentage. Percentage at each at each .4ge period. Total. age period. Total. age period. Under 1 2462 2.4 2965 2.2 1—5 9255 8.9 12171 8.9 5—10 11094 10.7 15176 11.2 10—15 10818 10.4 14275 10.5 15—25 19671 18.9 22940 16.9 25—35 15508 14.9 18610 13.7 35—45 12132 11.7 16007 11.8 45—55 9337 9.0 12743 9.4 55—65 7234 7.0 10719 7.9 65—75 4522 1 7033 4 75—85 16801 6.1 2859 7 A 85—95 189,’ 373 i / . 0 95 and upwards. 3I 7' 103905 135878](https://iiif.wellcomecollection.org/image/b30086450_0005.jp2/full/800%2C/0/default.jpg)