[Report 1904] / Medical Officer of Health, Salop / Shropshire County Council.
- Shropshire Council
- Date:
- 1904
Licence: Attribution 4.0 International (CC BY 4.0)
Credit: [Report 1904] / Medical Officer of Health, Salop / Shropshire County Council. Source: Wellcome Collection.
6/100 (page 6)
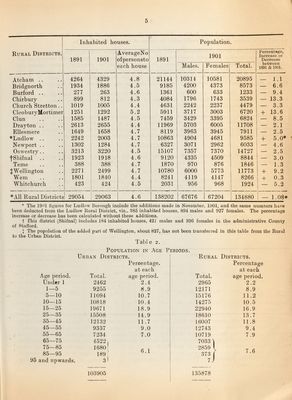
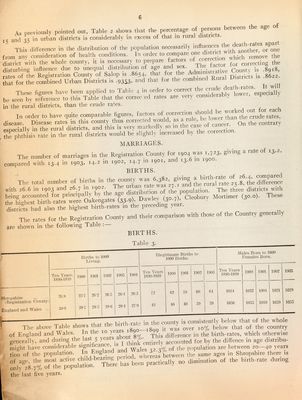
![4s previouslv pointed out, Table 2 shows that the percentage of persons between the age of 1=; and 35 in urban districts is considerably in excess of that in rural districts. This difference in the distribution of the population necessarily from anv consideration of health conditions. In order -^s'oT co ^ ^he district with the whole county, it is necessary to prepare factors of correcting the disturbing influence due to unequal distribution of age and sex. 1 he ‘ rountv is .8918, rates of the Registration County of Salop is .8654, that for the Aclminis 1 is 8622. Sat for the combined Urban Districts is ,9353. mtd that for the combined Rural D.str.c.s These figures have been applied to Talue 4 iu order to corrKt be seen by reference to this Table that the correc ed rates are very considera . in the rural districts, than the crude rates. In order to have quite comparable figures, factors of correction should be^ disease. Disease rates in this county thus corrected would ^t;e of circer On the contrarv e<;neriallv in the rural districts, and this is very markedly so in the case or ca the phthfsis rate in the rural districts would be slightly increased by the corr c MARRIAGES. The number of marriages in the Registration County ^ ^ compared with 13.4 in 1903, in 1902, i4-7 ^ 1901, and 13.6 m 1900. BIRTHS. The total number of births in s^j^ilnd with 26.6 in 1903 and 26.7 in 190-. The . r population. The three districts witn being accounted for principally b' Dawlev (^o 7) Cleobury Mortimer (30.0). These the highest birth-rates were Oakengates (33.9), DawleN {30.j), v.ieou > distdet had also the highest birth-rates in the precedtug year. The rates for the Registration County and their comparison with those of the Country genera ty are shown in the following Table;— births. » / Births to 1000 I.ivin.g. Ten Veai-s. 18'.H)-1S;)'.I moo mot mo2 mo.. moi Bhnipshire .; 20 8 2r)-7 20-2 2(l-.h 2(i'l 2(i;5 (Kegistralion County) England and IVales .. :ioo 28-7 28'.') 28'(1 28-1 27-!l Table 3. lllegitiiuate Births to moo Births. ’J'pii Years 18!K)-189'.I moo mm 11102 i9o;i 02 .I'l 00 01 10 '10 .111 .11) Hales Born to 1000 Bemales Born. Ten Years 181)0-181)9 1900 1901 7 190*2 ] 1903 1011 1032 1001 1021 1029 10.10 mil 1019 mill 1035 - , 1 • If i-is :,n fKo fVMint-v is ronsistentlv below that of the whole The above Table shows that the nr i8qq it was over io% below that of the country of England and Wales. In the lo g/ This difference in the birth-rates, which otherwise generally, and during ‘ “ 5 accounted for by the dilfenee in age distribu- f'’re T -d 3.3% of nopn.a..on - i-een ao-^,-- onlvi4‘,% rfheTpnlftit There' has bien practically .to diminntion of the birth-rate dunng the last five years. V](https://iiif.wellcomecollection.org/image/b30086450_0006.jp2/full/800%2C/0/default.jpg)