Volume 2
First-[second] report of the Royal Sanitary Commission.
- Great Britain. Royal Sanitary Commission
- Date:
- 1869-1874
Licence: Public Domain Mark
Credit: First-[second] report of the Royal Sanitary Commission. Source: Wellcome Collection.
Provider: This material has been provided by London School of Hygiene & Tropical Medicine Library & Archives Service. The original may be consulted at London School of Hygiene & Tropical Medicine Library & Archives Service.
46/418 (page 38)
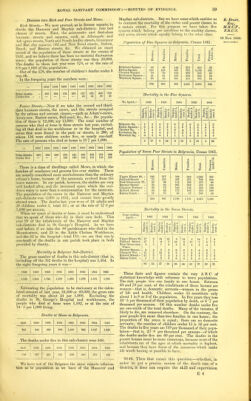
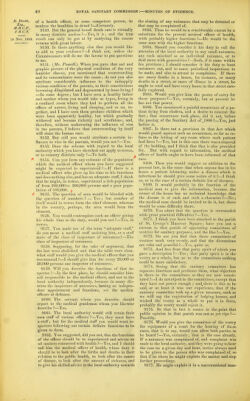
![R. Druitt, Esq., M.B.CP., F.R.C.S. 18 Nov. 1869. 1858, there died at home in the houses of the 20,000 better class, 425 persons, being at the rate of nearly 11 per 1,000 per annum of the population, as estimated in 1851. During the same two years there died in the homes of the 13,000 poor 544 persons, being at the rate of nearly 21 per 1,000 per annum of the persons who occupied these houses in 1851. In this statement all deaths in the workhouse, hos- pital, streets, and Serpentine, are left out, although they belong chiefly to the poor. But without them the dif- ference of the mortality in the two classes of residences is palpable enough. In the next place, taking 29 places called mews, with a population of 2,928 persons in 1851, the mortality in those mews was, during those two years, at the rate of 16 per 1,000 per annum, whereas the mortality of the remaining 10,072 of the poorer classes, who live in the lodging-houses in poor streets, was at the rate of 223 per 1,000 per annum. Thus the stables, some of which are even luxurious, although others are stiU ill-ventilated and rank enough, are as a whole, wholesomer than the lodging-houses. According to a report presented by Dr. Druitt, in April 1857, there were living in Brown Street 93 families, 47 of which, at the least, were provided with medical attendance and medicine hj charity. Of the 93 families, 3 had three or more rooms; 26 had two rooms ; 64 had one room each. In 61 of the rooms there lived 162 persons. The average size of these rooms from actual measurement, was 10 feet square, and 8 feet high, giving a cubic capacity of 800 feet; and the average rent 3s. 5d. weekly, Of course there are great varieties in the details. A kitchen measuring 1,145 feet, lets for 2s. 9d. ; a second floor front of the same dimensions for 4s.; a first floor front of 1,440 feet, for 4s. 9d.; a first floor front of 864 feet, for 4s. 6d.; a front parlour only 864 feet, inhabited by a shoemaker, also 4s. 6d. The number of inmates varies from 1 to 8. Taking 75 families, living in the other poorer districts (Hertford Place, May's Buildings, Carrington Street, Thomas Street, Grosvenor Market, &c.), it was found that 61 live in single rooms ; that tliese rooms, if measured, give an average cubic capacity of 982 feet; that the average number of inmates is 3'7, and the average rent 3s. 4d. In the model lodgings in Grosvenor Mews one set of rooms, 1,568 cubic feet, brings.a rental of 3s. 6d. per week; another, 1,480 feet, lets for 4s.; and a third, 2,160 cubic feet (that is a space 8 feet high, 27 long, and 10 broad), is let for 5s. All the lodgings in the model house, and in Bloomfield Buildings, which are built on the same plan, are subdivided into two apartments. (2.) Extract from Report No. XXX, dated 12th April 1865, addressed to the Vestry of St. George's, Hanover Square. Further Analysis of Population and Mortality of Belgrave Sub-District j Displacement of Population, SfC. Tlie lesson which we venture to enforce on the Vestry, as we ourselves learn it from an investigation of the facts, is that it is of little use to bring forward broad general figures \vithout entering into details : that to assert that a place is unhealthy intrinsically Ijecause a great many per- sons die there, is absurd; that sanitary matters, drains, cess[)ools, &c., are very important as causes o'f death, and S[)are neither rich nor poor; still that they form only a small share of the general conditions, whether of plenty or poverty, ignorance or knowledge, virtue or A'ice, love of life, or carelessness of life, in wliich a population lives. In fact the mortality is a test of the whole condition of the people, and not merely of the existence of nuisances as they are called. In former Reports we have given the mortality in a group of squares in the Belgrave sub-district, and com- pared it with that of a group of small streets, with the view of showing the greater general mortality in the poor streets than in the rich, and the greater proportion of children's deaths. But we were not in possession of figures to show the mortality per cent. Desirous of getting at some num- bers with respect to the Belgrave sub-district, and especially as regards the quantity of people displaced by the puUing down of houses, we made application to the Registrar- General, who kindly ordered the original Census docu- ments of 1861 to be brought from the House of Lords to Somerset House, and to be placed at our disposal. From these we made as many extracts as our time permitted, and propose to set them forth here, in order to show the dif- ference between a wealthy and a poor neighbourhood within the same sub-district. Suppose we take Belgrave Square as the type of the richer. The first fact is, that at the Census in April 1861, out of 49 houses, it is evident, from the returns, that only 22 families were in town; the remainder were at country seats, v/atering places. &c. And this gives us but an im- perfect idea of the extent of change enjoyed by the richer in the autumn. Secondly, Space.—The adjoining diagram represents the space occupied by the houses in Belgrave Square. At the BEKRAVESQ^ r r time of the Census the numbers in that square were 152 males, 274 females, total 418, of whom 22 were under 14. This is probably an average number for the whole year; but let us give all the houses the same population as those of which the owners were in town at the time of the Census, the full population would be 627. The next is a diagram of a space forming one of the enumeration districts of the Census, comprising parts of Little Ebury Street, Warrad's Court, Ebury Square (an open space). Flask Row, Susannah Place, Upper Ebury Street (part of), Kemp's Row, Bridge Row, Darnley Cot- tages, Flask Lane, Boyd's Gardens, Avery-farm Row (south side) Girdler's Mews, and Ebury Place. In this there were 545 males, 642 females, total 1,187 persons, of whom 392 were under 15 years of age. Thirdly, Arrangement of Space.—When many human bemgs are to be planted on a small space of ground, the dwelhngs should be in good blocks, so arranged as to let the sun and wind have full sweep ; and withou: odd close back yards, culs-de-sac, cou.rts, &c., &c. The distinction between dwelhngs of rich and poor is clear enor.gh in this respect from a glance at the diagrams. Fourthly, Proportions of the Sexes.—Nothing is more remarkable than the accumulation of women of the active and healthy time of life as servants in the houses of the rich. Throughout them the women are to the men as, two or three to one ; in the poorer the proportions are nearly equal. Fifthly, The Absence of Domestic Servants.—Out of the 333 families comprising; the 1,187 persons inhabiting the poor patch of streets above designated, there is not one domestic servant. Sixthly.—The proportion of children; always greatest where the faraihes are poorest and smallest. Hence such districts show the high mortality necessarily attendant on mfant life. Moreover, it is almost impossible for one woman to rear children ; she must have the aid of others of her own sex, and the deficient means of the poor tell heavily here. Such are some few of the evils of poverty and of the statistics of the poor. (5.) Further extract from Report No. XXXIV., 31st March 1866, on the difference between the gross mortality, and the mortality of special classes of houses in tlie parish of St. Georges, Hanover Square. Mortality and Death-Rate of Hanover and Mayfair. In these sub-districts the gross number of deaths, that is including all in the workhouse, in the year ended 31st March 1866, was 553 ; in the years— 1858 1859 1860 1861 1862 1863 1864 1885 563 COS 543 567 534 570 577 630 612 The gross death-rate of this part of the parish, therefore, this year has been 17; and has fluctuated during the last eight years, between 16 and 19 ])er 1,000 per annum, esti- mating the population as virtually stationaiy at 32,500.](https://iiif.wellcomecollection.org/image/b21366081_0002_0046.jp2/full/800%2C/0/default.jpg)