Report on the public health administration of the Punjab.
- Punjab (India). Public Health Department.
- Date:
- [1934]
Licence: Public Domain Mark
Credit: Report on the public health administration of the Punjab. Source: Wellcome Collection.
156/188 page 146
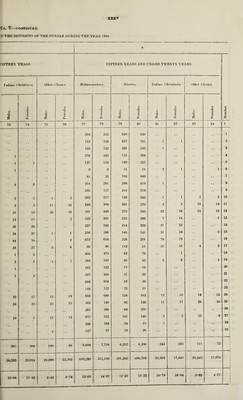
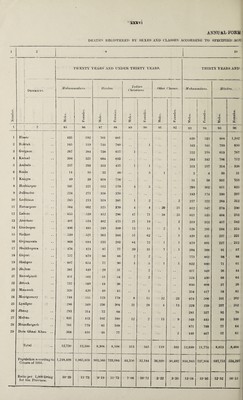
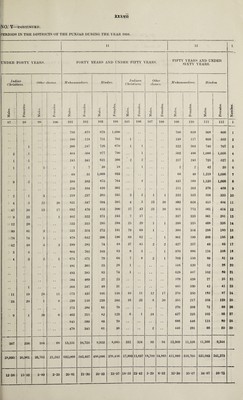
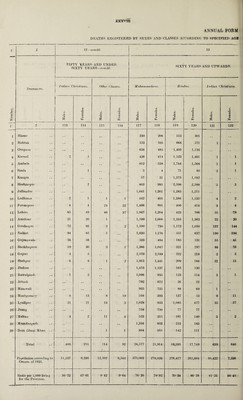
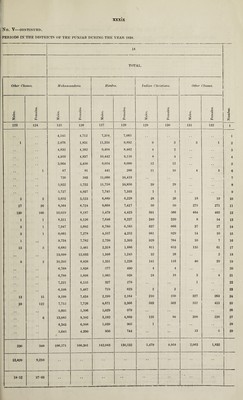
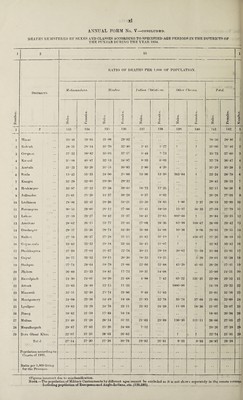
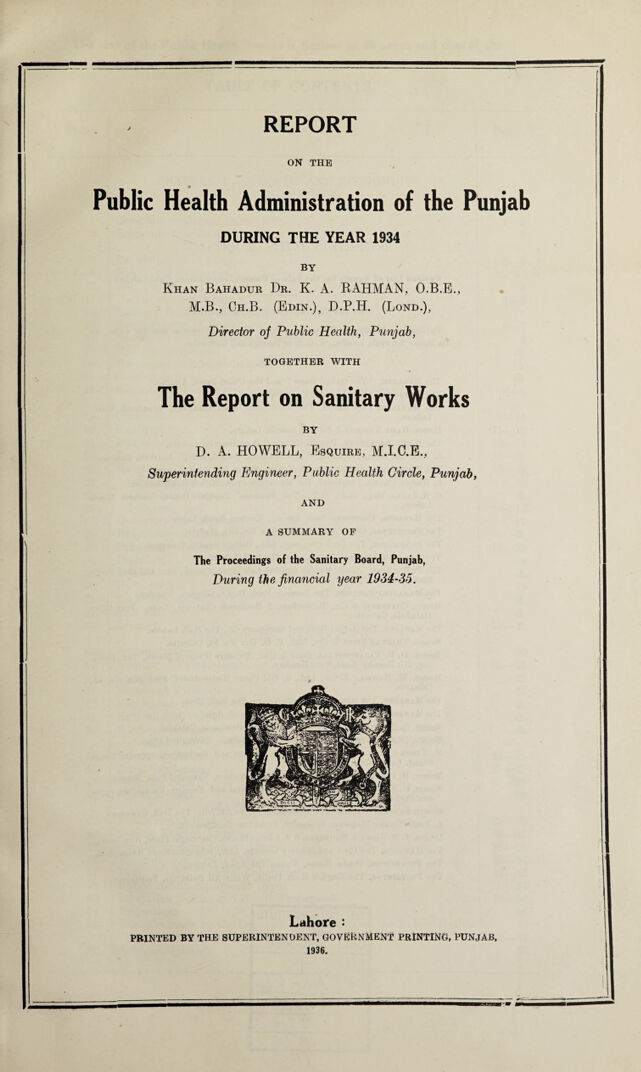
![ANNUAL FORM No. V—concluded. DEATHS REGISTERED BY SEXES AXD CLASSES ACCORDING TO SPECIFIED AGE PERIODS IN THE DISTRICTS OF THE PUNJAB DURING THE YEAR 1934. RATIO OF DEATHS PER 1.000 OF POPULATION. Districts. Muhammilans. Hindus. Indian 0 hristians. Other Classes. Total. : j Number. •soiepr ! 1 Females. Males. •sajtmiaj i | i Males. 1 1 [ Females. f f \ •sapjpi 1 1 Females. 1 .■f, • Males. Females. c & & S; £ 1 2 i 33 134 135 136 137 138 139 140 141 142 1 1 Hissar 33* 10 39*95 21*06 23*92 . , . • • . , , 24-50 28* 46 i 2 Rohiak 28-51 28* 14 31*70 32*40 2*45 1*27 9 9 31*00 31*46 2 1 f 3 Gurgaon 37-32 .98* 82 35 * 05 37*11 5*48 2*73 1 .. V * 35*73 37-60 3 4 Karn al 35* 08 10-87 32* 13 34*87 9*93 6*03 • • 32-79 36*47 i 5 Ambala 31*23 33*20 31*75 36*83 2*80 4*20 . • • X 31*29 35*38 5 6 Simla 15*42 55*33 24*00 25*88 13-96 13*30 363*64 V 22- 24 28*79 6 7 Kangra 32-29 32*95 29*30 29*32 ; *• 28* 45 28*53 (4r 7 8 Hoshiarpur 33*97 37*22 37*38 39*60 18-72 17*25 J * * 32*11 34*56 1 9 Jullundur 25*61 U> Jl Li © ' 31*37 39*28 0-37 0*62 ' * * v 26*28 27*93 9 10 Ludhiana 28*06 33*41 29*36 34*21 25*50 18-85 1*86 2*37 28*19 32*99 10 11 Ferozepore 30*55 28*60 26*12 27*88 11-41 18*59 13*97 16*33 27*59 27*79 ii 12 Lahore 21*59 23*27 18*42 21*37 18-41 22*65 602*60 J 20*84 23* 35 12 13 Amritsar 28*62 26 * 15 23*77 32*44 27-08 28*36 62*99 168*67 26*09 29*42 13 14 Gurdaspur 29*57 25 * 36 28*74 34*30 26-88 34*08 10*36 9*06 28*95 29*55 1 b 14 15 Sialkot i 27* 16 26*37 27*28 31*15 26-82 31*19 9 416*67 27*20 28*19 ]ii> 10 Gojt'ar, wala .33*82 33*32 29* 18 33*44 34*45 34*07 ? 9 i 32*82 33*42 16 17 Sheikhupura 27-39 27*01 21-67 22*78 30* 15 29* 19 20*82 11*59 25*88 25*81 18 Gujrat 30* 77 33*33 19* 18 20*30 18*33 19*25 ; • • 5-29 29' On! 31 * 38 4 19 iShahpur 27*71 28*61 18*79 21*06 22*66 22*88 45*20 41 • 05 26*28 27*41 19 20 Jhebim 26-89 25*33 18*81 17*73 10*31 14*08 , •• *• 25*99 24*51 20 21 Rawalpindi 21-30 24*01 18*20 21-68 4*88 7*42 65*22 121-21 22*99 23*52 21 22 Attock 25*83 24*40 12*15 11-33 1000*00 24*59 23*22 22 ? ' 23 Mianwalr 32*51 32*30 25*74 23*86 9*48 11*83 * 31*61 31*16 23 24 Montgomery 24*08 23*56 14*49 18*48 21*83 32*78 35*74 37-68 21*60 22*60 24 j 25 Lyallpur 19*82 23*28 24*78 23*11 23*82 24*39 11*09 18-36 21*07 23*07 25 20 Jhang 18*82 21*59 17*88 18* 18 • • • • 18*65 20*98 20 27 Multan ,25*40 21*28 26* 14 51*31 21*63 23*89 136*30 111*11 26*00 27*05 2^ 28 Muzaffargarh 29*87 27*82 25*20 24*69 7*5*2 • • ' * 20* 2€| 27*39 2^ t 29 Dora Ghazi Khari 22*07 21*25 28-03 26*62 • • • • 9 9 22*74 21*91 29 Total 27* 14 27*30 27-38 30*78 23*82 26*81 9*33 9-93 26*87 28*38 i 1 Population according to Census of 1931. ••• •• i ) . .. --j Ratio per 1,000 living for the Province. J: ' 1 • • i • • • • j • • *i * ! i : '! Figures incorrect due to misclassification. Note.—The population of Military Cantonments by different ages cannot be excluded as it is not shown separately in the census returns. Including population of Europeans and Anglo-Indians, etc. (120,585), . .. - J ... . _L. .](https://iiif.wellcomecollection.org/image/b31478013_0156.jp2/full/800%2C/0/default.jpg)