[Report 1946] / Medical Officer of Health, Newport (Gwent) County Borough.
- Newport (Wales). County Council.
- Date:
- 1946
Licence: Attribution 4.0 International (CC BY 4.0)
Credit: [Report 1946] / Medical Officer of Health, Newport (Gwent) County Borough. Source: Wellcome Collection.
10/102 page 8
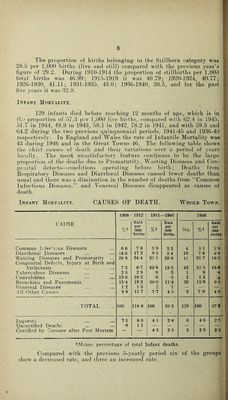
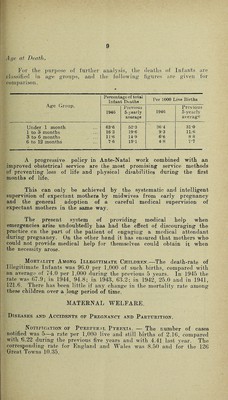
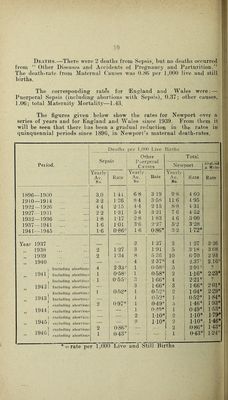
![Th& proportion of births belonging' to the Stillborn category was 28.5 per 1,000 births (live and still) compared with the previous year’s figure of 29.2. During 1910-1914 the proportion of stillbirths per 1,'00'0 total births was 46.99; 1915-1919 it was 40.79; 1920-1924, 40.77; 1926-1930, 41.11; 1931-1935, 43.0; 1936-1940, 38.5, and for the past five 3'ears it was 32.8. INFANT Mortality. 129 infants died before reaching 12 months of age,, which is in tlic proportion of 57.3 per 1,'00'0 live births, compared with 62.4 in 1945, 51.7 in 1944, 48.9 in 1943, 58.1 in 1942, 78.2 in 1941, and with 59.3 and 64.2 during the two previous quinquennial periods, 1941-45 and 1936-40 respectively. In England and Wales the rate of Infantile Mortality was 43 during 1946 and in the Great Towns 46. The following table shows the chief causes of death and their variations over a period of years locally. The mosti unsatisfactory feafture continues to be the large proportion of the deaths due to Prematurity, Wasting Diseases and Con- genital defects^—conditions operating before birth ; Deaths from Respiratory^ Diseases and Diarrhoeal Diseases ca.used fewer deaths than usual and there was a diminution in the number of deaths from “Common Infectious Diseases,’’ and Venereal Diseases disappeared as causes of death. : i ! Infant Mortality. CAUSES OF DEATH. Whole Town. 1908 1912 1941- -1946 1946 CAUSE %t Rate per 1000 Births %t Rate per 1000 Birtho No. %t Rate per 1000 Births Common IcferUjus Di.seases 6 6 7-8 3-9 2-3 4 31 1-8 Diarrhoea] Diseases U'5 17 3 91 5 4 10 7-8 4.4 VVastingr Diseases and Prematurity Congenital Defects, Injury at Birth and 28 9 34 4 35-1 20-8 41 31-7 18-2 Atelectasis 7-3 8'7 22-8 13-5 42 32 5 18-6 Tuberculous Diseases 2-5 2 9 •6 •3 1 •8 •4 Convulsions 13-6 16-2 ‘6 •3 2 1 5 •8 Bronchitis and Pneumonia 15'4 18-3 20-0 11‘8 20 15-6 8-8 Venereal Diseases T2 1-5 O ■1 — — — .A.11 Other Causes ... 9 8 11 7 7-7 4-5 9 7 0 40 TOTAL 100 118 9 100 59-3 129 100 57S Inquests 7T 8-5 41 2-4 6 4-6 2-7 Uncertified Deaihs •9 11 — — — — — Certified by Coroner after Post Mortem 4-3 2-5 5 3-9 2‘2 tMeans peicentag-e of total Infant deaths. Compared with the previous 5-yearljr period six of the groups show a. decreased ra'te^ and three an increased rate,](https://iiif.wellcomecollection.org/image/b28866873_0012.jp2/full/800%2C/0/default.jpg)