[Report 1946] / Medical Officer of Health, Newport (Gwent) County Borough.
- Newport (Wales). County Council.
- Date:
- 1946
Licence: Attribution 4.0 International (CC BY 4.0)
Credit: [Report 1946] / Medical Officer of Health, Newport (Gwent) County Borough. Source: Wellcome Collection.
12/102 page 10
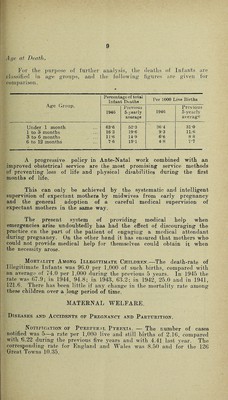
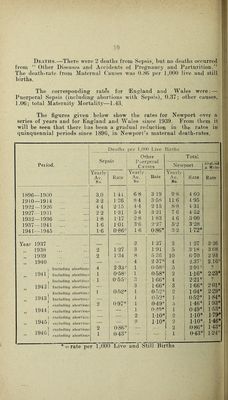
![Deaths.—There were 2 deaths from Sepsis, hut no deaths occurred 1 from “ Other Diseases and Accidents of Pregnancy and Parturition.” The death-rate from Ma.terna] Causes was 0.86 per 1,000 live and still : births. ;; The corresponding rates for England and Wales were:— | Puerperal Sepsis (including ahortions with Sepsis),, 0.37; other causes, : 1.06; total Maternity Mortality—1.43. [ The figxires given below show the rates for Newport over a series of years and for England and Wales since 1939. From them it will be seen that there has been a gradual reduction in the rates in quinquennial periods since 1896, in Newport’s maternal death-rates. Peiiod. Deaths per 1,00(1 Live [lirths Sepsis Other Puerperal Causes T otal Newport iOngl.md i Wale.'- Yearly Av. No. Rate Yearly Av. No Rate YearL- Av. ■ No. Rate Rate 1896—1900 .. 3.0 1 41 6-8 3 19 9 8 4 60 1910—1914 ... 3 2 1-36 8-4 3-58 11-6 4-95 1922—1926 ... 4-4 2T5 44 2T5 8-8 4-31 1927—1931 ... 2-2 1-31 5-4 3-21 7 6 4-52 1932-1936 ... 1-8 1T7 2-8 1-83 4 6 3-00 1937—1941 ... 1 6 101 3-6 2-27 5-2 3-28 1941—1945 ... 1-6 086- 1-6 0-86* 3-2 1-72* Year 1937 2 1-27 2 1 27 3-26 „ 1938 2 1-27 3 L91 5 3T8 3 08 „ 1939 2 1-34 8 5 36 10 6-70 2 93 „ 1940 — — 4 2 37* 4 2,37* 2.16* 1 Iiicliuting abortions 4 2-33- 1 0-58* 5 2-91* ? 1941 [ liiehuiing abortions 1 0-58- 1 0-58* 2 1-iG* 2-23* , Incliuting abortion.s 1 0-55=' O *) 1-6G* 4 2-21* 0 1942 ( liiclutling abortions — 3 166* 3 1-66* 2-01* . Including abortions 1 05-2* 1 0-52* 2 1-04* 2-29* 1943, Including abortions - 1 0-52* 1 0-52* 1-84* ” ) 1 excluding abortions 2 0-97* 1 0-4.9* 3 1-46* 1-93* 19-14: j excluding abortions — — 1 0-49* 1 0-49* 1-53* 1 excluding abortioiis — — 2 1-10* 2 1-10* 1-79* ,, 1945) excluding abortions — — 2 1-10* 2 1-10* 1-46* 1 excluding al)ortions 2 0-86* — — 2 0-86* 1-43* 1946 ” ' excluding abortions 1 0-43* — 1 0-43* 1-24* * = rate per 1,000 Live and Still Births li](https://iiif.wellcomecollection.org/image/b28866873_0014.jp2/full/800%2C/0/default.jpg)