[Report 1920] / Medical Officer of Health, Salop / Shropshire County Council.
- Shropshire Council
- Date:
- 1920
Licence: Attribution 4.0 International (CC BY 4.0)
Credit: [Report 1920] / Medical Officer of Health, Salop / Shropshire County Council. Source: Wellcome Collection.
13/62 (page 5)
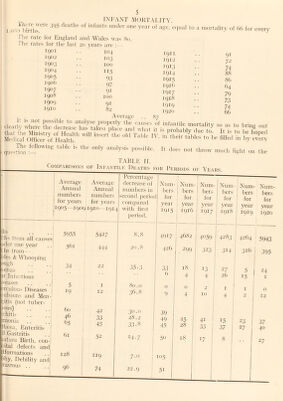
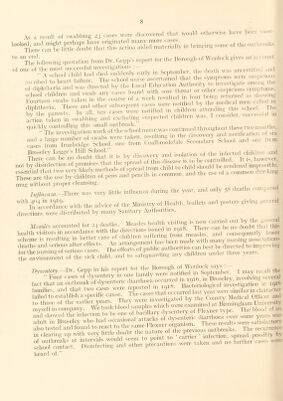
![MORTALITY. t.inir'''’' ‘I' “ '''lily of M, for ovory The rate for Eai,inland ami Wales was No. I fie rates lor the Iasi 20 years ar(' ; 19^)1 . . ' 104 1402 1904 i9<J5 1909 1907 1908 1909 iqio 103 100 115 93 97 91 100 91 82 A\-erage 8: 1911 1912 1913 1914 T915 1919 1917 1918 1919 1920 91 7-^ 74 88 89 94 79 73 74 69 I’*''''-- '1 >'nt Hiroiv mud, light on tl.e TABU-: II. Average Average Anitual Annual Jiumbers numbers for years for years 1905- 1909 I910A Percentage I decrease of Jiumbers in second period compai'cd with first liei'iod. hs chs from all causes 5955 5427 8.8 ider one 3,-ear hs from— 5fii 444 20.8 Hertr & Whoo])ii]g itenza ir Infectious •seases ■rculou' Diseases ulsions and Men r,itis (not tuber- »ous) :chiti> anonia fhoea, Enteritis II Gastritis lature Birtli, con- iital defects and formations ■•*hy, Debility and Tasrnus .. ' vJ“ 0 19 60 46 ^L5 91 I 12 42 33 43 52 128 99 119 74 •' -V ' oO • .j 80.0 36.8 40.0 28.2 33 • 8 14.7 7.0 22.9 Num- I Xum- 1 1 Num- Num- Num - Num- bei's i hers ! hers bers bers bers loj- for for for for for year 3,-ear 3ear { year veai year 1915 1916 1 1917 j 1918 1 1919 1920 4917 4982 ! 4059 1 4283 4264 5943 426 299 • 323 314 316 ' 395 1 33 t) 18 13 27 5 ! 1 4 4 29 15 ' I 0 2 I I 1 < 0 9 4 1 10 ; 4 2 12 39 1 49 -5 1 41 1 15 23 37 45 28 33 j 37 27 40 50 t8 j 17 I 8 27 J<».5 51](https://iiif.wellcomecollection.org/image/b30086589_0015.jp2/full/800%2C/0/default.jpg)