First (-Second) report of the Royal Commission appointed to inquire into the subject of vaccination; with minutes of evidence and appendices.
- Great Britain. Royal Commission on Vaccination.
- Date:
- 1889-1890
Licence: Public Domain Mark
Credit: First (-Second) report of the Royal Commission appointed to inquire into the subject of vaccination; with minutes of evidence and appendices. Source: Wellcome Collection.
Provider: This material has been provided by London School of Hygiene & Tropical Medicine Library & Archives Service. The original may be consulted at London School of Hygiene & Tropical Medicine Library & Archives Service.
126/520 (page 114)
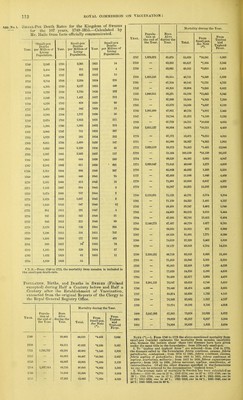
![App. No, 2. APPENDIX II. (^Papers handed in by Mr. William Ogle, M.D., ird and lOth July 1889.) ENGLAND AND WALES. Table A. Deaths from Small-pox per million living, 1838-42 and 1847-87. Year. Deaths. Year. Deaths. Year. Deaths. Year. Deaths. 1838 1,064 1851 389 1864 367 1877 17S 1839 589 1852 401 1865 303 1878 79 1840 661 1853 171 1866 141 1S79 25 1841 400 1851 1.51 1867 116 1880 29 1842 168 ]f!55 134 1868 93 1881 124 1843 P 1856 119 1869 70 1882 5t 1844 ? 1857 204 1870 116 1883 39 1845 p 1858 3.32 1871 1,015 1884 87 1846 f 1859 195 1872 821. 1S85 107 1847 246 1860 1.38 1873 101 1880 13 1848 397 1861 66 1874 91 1887 21 1849 264 1862 80 1875 40 1850 262 1863 289 1876 103 N.B.—The above figures include deaths from chiekon-pox. Table B. Mean Annual Deaths from Small-pox, at successive life-periods, per million living at eacli such life- period, 1847-53, 1854-71, and 1872-87. Period. All ages. 0-5. 5-10. 10-15. 15-25. 25-45. 15 and up- wards. (1.) Vaccination op- tional, 1847-53.* 305 1,617 337 94 109 66 22 (2.) Vaccination olili- jrator.v, Vjut not elliciently en- forced, 1854-71. 223 817 243 88 163 131 52 (3.) Vaccination obli- gatory, but more pIHciently en- forced by vacci- nation officers, 1872-87. 114 242 120 09 122 107 47 * In this table the period of optionMl vaccination liegins witli 1847, not with 1838, bec;iuse the deaths were not abstracted in combination with ages until 1847. Table C. Mean Annual Deaths from Fever, at successive life- periods, per million living at each such life-period, 1847-53, 1854-71, and 1872-87. Period. All ages. 0-5. 5-10. 10-15. 15-25. 25-45. 45 and up\vards. 1817-53 1,139 1,512 1,118 911 1,103 910 1,388 1854r-7l 870 1,297 933 713 807 656 972 1872-87 367 420 379 341 ■131 327 323 Table D. NuMiiEK of Deaths, and Vaccinational Condition, of those being over 3 months but under 10 years of age who died from Small-pox in England and Wales, 1881-87. Vaccinational Condition. Deaths, 1881-87. Vaccinated .... Unvacoinated .... No statement .... Total 145 1,427 1,402 2,974 Note.—The unvaccina.ted are 908 per cent, of those as to whose vaccinational condition there was information, and 48'0 per cent, of the whole. Table E. Proportion of Deaths under and over 15 years of age, per 1,000 deaths from Small-pox in Vaccinated and Unvacoinated Persons respectively, 1881-87 (ex- cluding deaths under three months). Age. TJnvaocinated. Vaccinated. Three months and under 15 years - 597 126 Fifteen years and upwards - 403 874 1,009 1,000](https://iiif.wellcomecollection.org/image/b21361332_0126.jp2/full/800%2C/0/default.jpg)