[Report 1960] / Medical Officer of Health, Alnwick U.D.C.
- Alnwick (England). Urban District Council.
- Date:
- 1960
Licence: Attribution 4.0 International (CC BY 4.0)
Credit: [Report 1960] / Medical Officer of Health, Alnwick U.D.C. Source: Wellcome Collection.
8/32 page 4
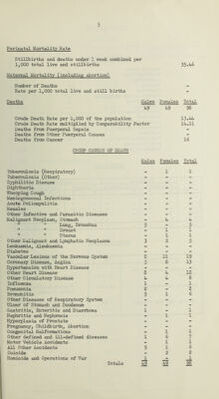
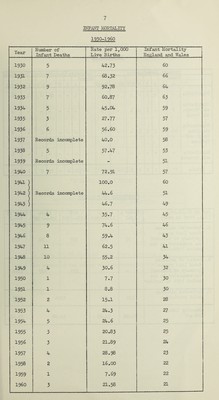
![GENERAL STATISTICS The area of the district was 4,778 acres. The number of inhabited houses was 2,4-50 and the number of new houses completed during the year was 21. The rateable value was £85,510 and the sum represented by a penny rate was £336. The estimated mid-year population was 7,290 and this figure was taken when calculating the Birth and Death rate. VITAL STATISTICS Live Births Males Females Total Legitimate 57 80 137 Illegitimate _2 - 2 Totals £9 80 112 Crude Birth Rate per 1,000 of the population 19.06 Crude Birth Rate multiplied by Comparability Factor 18.86 Illegitimate live births per cent of total live births 1.43 Still Births Legitimate — 2 2 Illegitimate Z, - - Totals 2 2 Stillbirth rate per 1,000 total live and still births 14-.18 Total live and still births 141 Infant Deaths (deaths under 1 year) Legitimate 1 23 Illegitimate z. ZL — Totals 1_ 2 ]>_ Infant Mortality Rates Total infant deaths per 1,000 total live births 21.58 Legitimate infant deaths per 1,000 legitimate live births 21.89 Illegitimate infant deaths per 1,000 illegitimate live births - Neo-natal Mortality Rate Legitimate 1 Illegitimate z. Totals 1 Deaths under 4- weeks per 1,000 total live births Early Neo-natal Mortality Rate Legitimate 1 Illegitimate - Totals 1 2 3 1 I 21.58 2 3 I I 21.58 Deaths under 1 Y/eek per 1,000 total live births](https://iiif.wellcomecollection.org/image/b28801313_0008.jp2/full/800%2C/0/default.jpg)