[Report 1968] / Medical Officer of Health, Andover R.D.C.
- Andover (England). Rural District Council.
- Date:
- 1968
Licence: Attribution 4.0 International (CC BY 4.0)
Credit: [Report 1968] / Medical Officer of Health, Andover R.D.C. Source: Wellcome Collection.
13/36 (page 4)
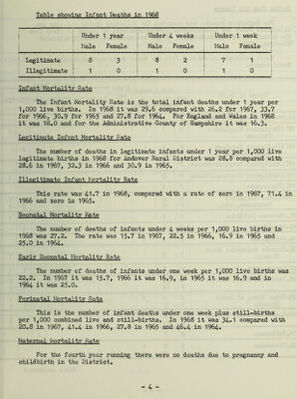
![Table showing Infant Deaths in 1968 i ] Under 1 year Under 4 weeks Under 1 week j I Male Female Male Female Male Female Legitimate 8 3 8 2 7 1 Illegitimate ; 1 0 1 0 1 0 Infant Mortality Rate The Infant Mortality Rate is the total infant deaths under 1 year per 1.000 live births. In 1968 it was 29.6 compared with 26.2 for 1967, 33.7 for 1966, 30.9 for 1965 and 27.8 for 1964. For England and Wales in 1968 it was 18.0 and for the Administrative County of Hampshire it was 16.3. Legitimate Infant Mortality Rate The number of deaths in legitimate infants under 1 year per 1,000 live legitimate births in 1968 for Andover Rural District was 28.8 compared with 28.6 in 1967, 32.3 in 1966 and 30.9 in 1965. Illegitimate Infant Mortality Rate This rate was 41.7 in 1968, compared with a rate of zero in 1967, 71.4 in 1966 and zero in 1965. Neonatal Mortality Rate The number of deaths of infants under 4 weeks per 1,000 live births in 1968 was 27.2. The rate was 15.7 in 1967, 22.5 in 1966, 16.9 in 1965 and 25.0 in 1964. Early Neonatal Mortality Rate The number of deaths of infants under one week per 1,000 live births was 22.2. In 1967 it was 15.7, 1966 it was 16.9, in 1965 it was 16.9 and in 1964 it was 25.0. Perinatal Mortality Rate This is the number of infant deaths under one week plus still-births per 1,000 combined live and still-births. In 1968 it was 34.1 compared with 20.8 in 1967, 41.4 in 1966, 27.8 in 1965 and 46.4 in 1964. Maternal Mortality Rate For the fourth year running there were no deaths due to pregnancy and childbirth in the District.](https://iiif.wellcomecollection.org/image/b28806980_0013.jp2/full/800%2C/0/default.jpg)