[Report 1967] / Medical Officer of Health, Salop / Shropshire County Council.
- Shropshire Council
- Date:
- 1967
Licence: Attribution 4.0 International (CC BY 4.0)
Credit: [Report 1967] / Medical Officer of Health, Salop / Shropshire County Council. Source: Wellcome Collection.
67/96 (page 61)
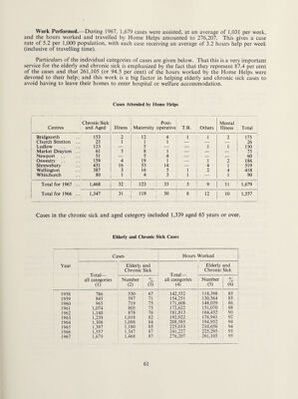
![Work Performed.-—During 1967, 1,679 cases were assisted, at an average of 1,031 per week, and the hours worked and travelled by Home Helps amounted to 276,207. This gives a case rate of 5.2 per 1,000 population, with each case receiving an average of 3.2 hours help per week (inclusive of travelling time). Particulars of the individual categories of cases are given below. That this is a very important service for the elderly and chronic sick is emphasized by the fact that they represent 87.4 per cent of the cases and that 261,105 (or 94.5 per cent) of the hours worked by the Home Helps were devoted to their help; and this work is a big factor in helping elderly and chronic sick cases to avoid having to leave their homes to enter hospital or welfare accommodation. Cases Attended by Home Helps ' Chronic Sick Post- Mental Centres and Aged Illness Maternity operative T.B. Others Illness Total Bridgnorth 153 2 12 4 1 1 2 175 Church Stretton 23 1 1 1 — — — 26 ' Ludlow 123 — 5 — — 1 1 130 Market Drayton 61 5 8 1 — — — 75 j Newport 51 — 5 4 — -- — 60 Oswestry 159 4 19 1 — 1 2 186 ' Shrewsbury 431 16 53 14 4 1 519 1 Wellington 387 3 16 5 1 2 4 418 ^ 90 1 Whitchurch 80 4 3 1 1 Total for 1967 1,468 32 123 33 3 9 11 1,679 ] Total for 1966 1,347 31 119 30 8 12 10 1,557 i Cases in the chronic sick and aged category included 1,339 aged 65 years or over. Elderly and Chronic Sick Cases Year Cases Hours Worked Total— all categories (1) Elderly and Chronic Sick Total— all categories (4) 1 Elderly and Chronic Sick Number (2) 7o (3) Number (5) % (6) 1958 786 530 67 142,552 ! 118,398 83 1959 845 597 71 154,251 130,564 85 1960 965 719 75 171,608 148,039 86 1961 1,074 803 75 172,622 151,070 88 i 1962 1,148 878 76 181,813 164,432 90 1963 1,239 1,018 82 192,922 176,941 92 1964 1,308 1,098 84 208,585 194,952 94 1965 ' 1,397 1,180 85 225,033 210,656 94 1966 1,557 1,347 87 241,227 225,295 93 1967 ' 1,679 1,468 87 276,207 261,105 95](https://iiif.wellcomecollection.org/image/b30087053_0067.jp2/full/800%2C/0/default.jpg)