[Report 1900] / Medical Officer of Health, Yeadon U.D.C.
- Yeadon (England). Urban District Council.
- Date:
- 1900
Licence: Attribution 4.0 International (CC BY 4.0)
Credit: [Report 1900] / Medical Officer of Health, Yeadon U.D.C. Source: Wellcome Collection.
5/28 page 5
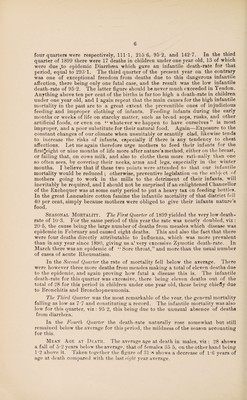
![as at present constituted the census figures are only of value for statistical purposes for the succeeding four or five years. In France and Denmark a census is taken every five years. In Germany and Belgium, every three years and in Austria actually every year. It seems therefore that this country is in this as in many other matters behind its neighbours. The following are the figures for the previous three decades : In 1871 the population was 5246. 1881 ,, ,, 6534. lo91 ,, ., 7396. If we estimate the population according to the inhabited houses which has in the past gives fairly approximate figures we get, allowing an average of 4 75 persons to each house a population of 7761 The “ Natural ” increase in the population, that is the excess of births over deaths, which this year numbers 77, would raise the estimated population of last year to M77, but against this increase we have to allow for a probable increased emigration of whole families. Birth-Rate. There were 189 births during the year, 102 males and 87 females, yielding a Birth-Rate of only 23 per thousand per S'ms living, this being as much as 5T below the ] revious ten year average. Last year tin re were 180 births, equal to 2'2 2, which was the lowest rate back to 1889. The birth-rate is unsatisfactory, being upwards of 6 per thousand below the rate for the United Kingdom, which rate by tin way is as much as 5 1 per thousand lower than it was 25 years ago—a serious e|u< stion as regards our premier position among the nations. The birth-rate of Yeadon for the last two years is a fraction lower, than that of France which has the lowest birth-rate of any European nation. That our present low rate is not an accidental occurrence but the result of a steady decrease is shown by the average figures of the last 15 years. Average yearly births per thousand of population living. During the five years 1886 to 1890 the rate averaged 33T. ,, ,, 1891 to 1895 ,, ,, 29-4. ,, ,, 1896 to 1900 ,, ,, 25 1. Of the births 12 were illegitimate, 7 males and 5 females, equal to D4 per thousand or 6 3 per cent of the total births and -6 above the ten year average. Death-Rate. During the year there were 112 deaths registered, 48 males and 64 females, equal to a death-rate of 13-6 per thousand persons living. This is very satisfactory being 2*5 below the previous ten year average. The death-rate for the four quarters were as follows, 20 5, 13 6, 7.7 and 12 5, respectively, that of the third quarter constituting the lowest quarterly death-rate of which I have any figures, the next lowest being that of the third quarter in 1898 when the rate equalled 7-9. Corrected Death-Rate. 5 deaths, 2 males and 3 females, of persons belonging to Yeadon occurred in various institutions outside the district, (Excluding Leeds Infirmary which did not reply to my enquiry) and 6 deaths, 2 male and 4 females Were registered in our district of persons not belonging thereto, thereby altering our general death-rate to the correct one of 13 5 per thousand. Infantile Death-Rate. During the year there were 27 deaths registered of children under one year old, and which, calculated on the number of births during that period (189) give us an infantile mortality of 1^’8 per thousand Births, this being 14T higher than the previous ten year average. The rates for the](https://iiif.wellcomecollection.org/image/b30430288_0005.jp2/full/800%2C/0/default.jpg)