Report of the Joint Working Party on the Medical Staffing Structure in the Hospital Service.
- Great Britain. Joint Working Party on the Medical Staffing Structure in the Hospital Service
- Date:
- 1961
Licence: Public Domain Mark
Credit: Report of the Joint Working Party on the Medical Staffing Structure in the Hospital Service. Source: Wellcome Collection.
19/100 page 11
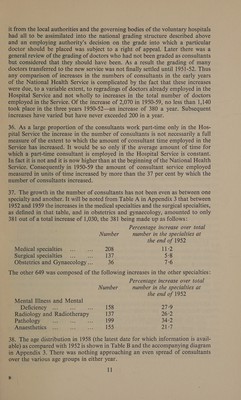
![it from the local authorities and the governing bodies of the voluntary hospitals had all to be assimilated into the national grading structure described above and an employing authority’s decision on the grade into which a particular doctor should be placed was subject to a right of appeal. Later there was a general review of the grading of doctors who had not been graded as consultants but considered that they should have been. As a result the grading of many doctors transferred to the new service was not finally settled until 1951-52. Thus any comparison of increases in the numbers of consultants in the early years of the National Health Service is complicated by the fact that these increases were due, to a variable extent, to regradings of doctors already employed in the Hospital Service and not wholly to increases in the total number of doctors employed in the Service. Of the increase of 2,070 in 1950-59, no less than 1,140 took place in the three years 1950-52—an increase of 380 a year. Subsequent increases have varied but have never exceeded 200 in a year. 36. As a large proportion of the consultants work part-time only in the Hos- pital Service the increase in the number of consultants is not necessarily a full measure of the extent to which the amount of consultant time employed in the Service has increased. It would be so only if the average amount of time for which a part-time consultant is employed in the Hospital Service is constant. In fact it is not and it is now higher than at the beginning of the National Health Service. Consequently in 1950-59 the amount of consultant service employed measured in units of time increased by more than the 37 per cent by which the number of consultants increased. 37. The growth in the number of consultants has not been even as between one specialty and another. It will be noted from Table A in Appendix 3 that between 1952 and 1959 the increases in the medical specialties and the surgical specialties, as defined in that table, and in obstetrics and gynaecology, amounted to only 381 out of a total increase of 1,030, the 381 being made up as follows: Percentage increase over total Number number in the specialties at the end of 1952 Medical specialties... ie 208 Liv Surgical specialties... ia Ly, | 5:8 Obstetrics and Gynaecology ... 36 ri The other 649 was composed of the following increases in the other specialties: Percentage increase over total Number number in the specialties at the end of 1952 Mental Illness and Mental Deficiency ... a 158 27-9 Radiology and Radiotherapy 137 PXTH) Pathology a ie ey 199 34-2 Anaesthetics ... sit Ge 155 Dh 38. The age distribution in 1958 (the latest date for which information is avail- able) as compared with 1952 is shown in Table B and the accompanying diagram in Appendix 3. There was nothing approaching an even spread of consultants over the various age groups in either year. 1]](https://iiif.wellcomecollection.org/image/b32172540_0019.jp2/full/800%2C/0/default.jpg)