Vaccination returns of the Province of Assam : with brief explanatory notes.
- Assam
- Date:
- [1913]
Licence: Public Domain Mark
Credit: Vaccination returns of the Province of Assam : with brief explanatory notes. Source: Wellcome Collection.
12/24 page 8
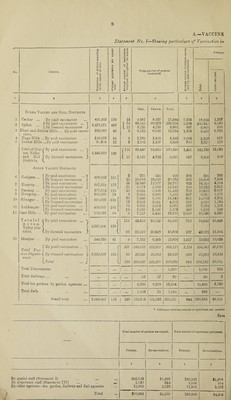
![A.—VACCINE Statement No. I—Showing particulars of Vaccination in ^— bC •9 hi Bquaro «r a M 0 0 m rt <u C » fl *0 0 rt > Primayr o *3 © CO £3 • ■kS p* c 0 IH & oc‘ 0 to +3 © rt a a *o’§ No District. 'Cio OS CQ 9 § « 9 Pi 0 0* to Q ® 2 Total number of persons vaccinated. to C3 © to 5 0 •3 rt to * CD to> •2 S c3 © © U) © © >. bo 0 * e 0 p/t! 2i © CO *7: to P4 *5 to T3 © © © (2 i a <1 to * O H a & 1 S 3 4 6 6 7 8 9 Male. Female. Total. Surma Valley and Hill Districts. 1 Cachar ... By paid vaccinalors 497,463 139 15 9.567 8,337 17,904 1,193 16,559 1,357 2 Svllipf I By paid vaccinators ... \ ^ IBy licensed vaccinators I 2,473,671 458 < 79 l H 68,855 5,135 60,673 4,726 129,528 9,861 1,640 897 109,242 9,809 8,090 510 3 Khasi and Jaintia Hills ... By paid vaccin- 235,069 40 9 6,126 6,098 12,224 1,358 9,413 1,789 ators. 4 Naga Hills ...Bv paid vaccinators 149.623 48 5 2,790 2,553 5,343 1,068 6,317 677 5 Lushai Hills ...By paid vaccinators 91,204 12 5 2,102 1,397 3,499 700 3,22; 110 1 otal of Sur- f By paid vaccinators ... ma Valley \ C 3,446,030 136 f113 89,440 79,058 168,498 1,491 143,760 12,023 and Hill 1 By licensed vaccinators j District?. (. l 11 5,135 4728 9,861 897 9,809 510 Assam Valley Districts. 6 Goalpara... I By paid vaccinators ...] (.By licensed vaccinators j 600,643 151 £ 2 25 221 10,836 195 10,040 416 20,876 208 835 991 18,908 286 7,286 7 Jvamrup ... I By paid vaccinators ... 7 (. By licensed vaccinators > 667,828 1731 46 31 16,440 6,572 13,277 5,769 5,418 28,717 12,341 623 398 26,454 12,333 5,S94 2,615 8 Darrang ... By paid vaccinators 377,314 110 16 6,044 11,492 718 10,663 2.017 9 Nowgong... By paid vaccinators 303,596 79 8 3,355 3,200 6,555 817 6,565 1,975 10 Sibsagar ... fJJy Paid vaccinators ... 1 (. By licensed vaccinators j 690,299 138 £ 23 12 7,440 2,252 6.076 2,061 14,146 4,313 6L5 359 14,012 4,313 4,361 1,184 11 Labhimpnr IJy paid vaccinators ... 7 (By licensed vaccinators ) 468,989 103 f 14 14 4,202 3,530 3,873 2,998 8,075 6,528 577 466 7,974 6,518 1,766 919 12 Garo Hills ... By paid vaccinators 158,936 50 6 7,117 5,443 12,560 2,093 10,796 9,330 Totalof (Bv paid vaccinators ... V Assam} / Valley Dis- j ( 3,267,605 118 5 115 43,819 38,142 81,961 713 76,845 25,648 tricts. (By licensed vaccinators j L 82 23,190 20,863 44,058 537 42,072 1.1,904 13 Manipur ... By paid vaccinators 346,222 41 9 7,253 6,403 13,656 1,517 13,656 10,039 CBy paid vaccinators ... D r i 237 140,512 123,603 264,115 1,114 234,261 47,710 Total Vac- J cine Depart- \ By Licensed vaccinators 7,059,557 115*i 93 28,325 25,594 53,919 580 51,881 12,414 ment. j LTotal ... J 330 168,837 149,197 318,034 964 286,142 60,124 Total Dispensaries ... ... ... ... 1,590 % 1,036 284 Total Railways ... ... I ~ 52 17 69 • • • 69 3 Total tea gardens by garden agencies ... 1 ... , ... 6,226 6,278 12,504 ... | 11,450 5,780 Total Jails • • • • • • ... ••• 1,128 31 1,154 286 • • • Grand total 7,069,857 115 | 330 176,258 155,523 333,351 964 298,983 66,191 1 * Difference between number of operetions and number Sum Total Dumber of persons vaccinated. # Total number of operations performed. Primary. Re-vaccinations. Primary. Re-vccinations. l 2 S 4 5 By special staff (Statement I) By dispensary staff (Statement III) ... ... ... By other agencies—tea garden, Railway and Jail agencies 286,142 1,036 11,805 31,892 564 1,922 286,142 1,036 11,805 Si,904 554 1,922 Total 298,983 34,368 298,983 34,308](https://iiif.wellcomecollection.org/image/b3149576x_0012.jp2/full/800%2C/0/default.jpg)