The health of welders / by A.T. Doig and L.N. Duguid.
- Great Britain. HM Factory Inspectorate
- Date:
- 1951
Licence: Public Domain Mark
Credit: The health of welders / by A.T. Doig and L.N. Duguid. Source: Wellcome Collection.
57/92 page 55
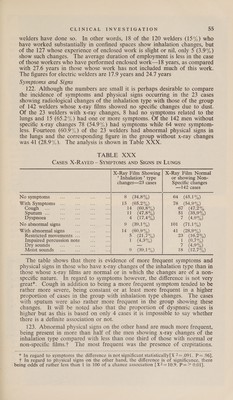
![welders have done so. In other words, 18 of the 120 welders (15%) who have worked substantially in confined spaces show inhalation changes, but of the 127 whose experience of enclosed work is slight or nil, only 5 (3.9%) show such changes. The average duration of employment is less in the case of those workers who have performed enclosed work—18 years, as compared with 27.6 years in those whose work has not included much of this work. The figures for electric welders are 17.9 years and 24.7 years Symptoms and Signs 122. Although the numbers are small it is perhaps desirable to compare the incidence of symptoms and physical signs occurring in the 23 cases showing radiological changes of the inhalation type with those of the group of 142 welders whose x-ray films showed no specific changes due to dust. Of the 23 welders with x-ray changes, 8 had no symptoms related to the lungs and 15 (65.2%) had one or more symptoms. Of the 142 men without specific x-ray changes 78 (54.9%) had symptoms while 64 were symptom- less. Fourteen (60.9%) of the 23 welders had abnormal physical signs in the lungs and the corresponding figure in the group without x-ray changes was 41 (28.9%). The analysis is shown in Table XXX. TABLE XXX CASES X-RAYED — SYMPTOMS AND SIGNS IN LUNGS X-Ray Film Showing | X-Ray Film Normal ‘ Inhalation ’ type or showing Non- changes—23 cases Specific changes —142 cases No symptoms sia ner “ae ae 8 (34.8%) 64 (45.1%) With Symptoms ... SAE oe es 15 (65.2%) 78 (54.9%) Cough .:. oe es vhs mds 14 (60.8%) 67 47.29%, Sputum ... — ee e? Be 11 (47.8%) ol G59 7,) Dyspnoea £4 oo Si es 4 (17.4%) 7 (4.9%) No abnormal signs pee ay Be D392 %) 101 2G, With abnormal signs val ee va 14 (60.9%) 41 (28.9%) Restricted movements ... oe is: Oe (2h. 75) 23, (16.29%) Impaired percussion note 3 oe 1 (4.3%) Ee (O75) Dry sounds ae SA 3 ee —— 7 (4.9%) Moist sounds ... a ih “ge 9 (39;:1%) Se Glan) The table shows that there is evidence of more frequent symptoms and physical signs in those who have x-ray changes of the inhalation type than in those whose x-ray films are normal or in which the changes are of a non- specific nature. In regard to symptoms however, the difference is not very great*. Cough in addition to being a more frequent symptom tended to be rather more severe, being constant or at least more frequent in a higher proportion of cases in the group with inhalation type changes. The cases with sputum were also rather more frequent in the group showing these changes. It will be noted also that the proportion of dyspneeic cases is higher but as this is based on only 4 cases it is impossible to say whether there is a definite association or not. 123. Abnormal physical signs on the other hand are much more frequent, being present in more than half of the men showing x-ray changes of the inhalation type compared with less than one third of those with normal or non-specific films.t The most frequent was the presence of crepitations. * In regard to symptoms the difference is not significant statistically|X 2=.091. P=.96]. + In regard to physical signs on the other hand, the difference is of significance, there being odds of rather less than 1 in 100 of a chance association [X2=10.9. P==> 0.01].](https://iiif.wellcomecollection.org/image/b3217357x_0057.jp2/full/800%2C/0/default.jpg)
 No text description is available for this image
 No text description is available for this image
 No text description is available for this image