Volume 1
Survey of the river Tees.
- Great Britain. Water Pollution Research Board
- Date:
- 1931-1937
Licence: Public Domain Mark
Credit: Survey of the river Tees. Source: Wellcome Collection.
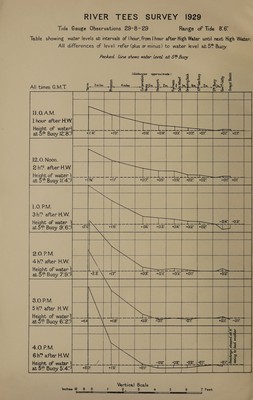
108/112 (page 96)
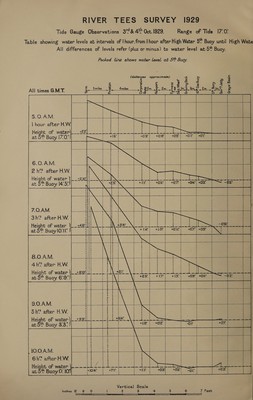
![Tide Gauge Observations 3%& 4 Oct. 1929. Range of Tide 17:0’ Table showing water levels at intervals of | hour, from |hour after High Water 5% Buoy until High Wate All differences of levels refer (plus or minus) to water level at 5% Buoy. Packed Unie shane wareiretaae 2 Buoy (distances approximate) x Ey a 8 ¢ 8 @ 2 8 9 % o By ee . Hi miles m. i F b Moe, m. m=: All times G.M-T. me § Pong im ot 3 img ling. <tn ie oF 5.0. A.M. ] hour after H.W. Height of water at 5 Buoy 17:0:' [ | 6.0.A.M. Ls : 2 h'S after HW = Height of water }L_ 20%! at 5 Buoy a * | : | 7.0.AM. ene e | | 3h? after H.W. ° Height of water \ 4.6: # at 5% Buoy lO‘tI” J 8.0.AM. | - 4h after H.W. elo: 2 Height ot watery Ll Sue at 5 Buoy 6/9 et | 9.0.AM. qe Shs after H.W. oe Height of water \| 89:1: i: : +64: _\ woe buy es) | te) A | lO.O A.M. Gh™ after H.W | Hbipns of water |. at 5® Buoy 0: 10° Inches 12 6 O 1 2 3 4 5 *) 7 Feet Sanna ee ee ane](https://iiif.wellcomecollection.org/image/b32179595_0001_0108.jp2/full/800%2C/0/default.jpg)