Volume 1
Survey of the river Tees.
- Great Britain. Water Pollution Research Board
- Date:
- 1931-1937
Licence: Public Domain Mark
Credit: Survey of the river Tees. Source: Wellcome Collection.
17/112 page 5
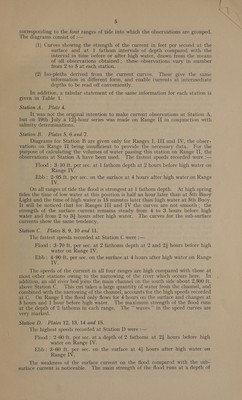
![corresponding to the four ranges of tide into which the observations are grouped. The diagrams consist of :— (1) Curves showing the strength of the current in feet per second at the surface and at 1 fathom intervals of depth compared with the interval in time before or after high water, drawn from the means of all observations obtained ; these observations vary in number from 2 to 5 at each station. (2) Iso-pleths derived from the current curves. These give the same information in different form, and enable currents at intermediate depths to be read off conveniently. In addition, a tabular statement of the same information for each station is given in Table 1. Station A. Plate 4. It was not the original intention to make current observations at Station A, but on 19th July a 123-hour series was made on Range II in conjunction with salinity determinations. Station B. Plates 5, 6 and 7. Diagrams for Station B are given only for Ranges I, Il] and IV, the obser- vations on Range II being insufficient to provide the necessary data. For the purpose of calculating the volumes of water passing this station on Range II, the observations at Station A have been used. The fastest speeds recorded were :— Flood : 3-10 ft. per sec. at 1 fathom depth at 2 hours before high water on > Range IV. Ebb: 2-95 ft. per sec. on the surface at 4 hours after high water on Range EV. On all ranges of tide the flood is strongest at 1 fathom depth. At high spring tides the time of low water at this position is half an hour later than at 5th Buoy Light and the time of high water is 15 minutes later than high water at 5th Buoy. It will be noticed that for Ranges III and IV the curves are not smooth; the strength of the surface current remains steady from 4 to 3 hours before high water and from 2 to 34 hours after high water. The curves for the sub-surface currents show the same tendency. Station C. Plates 8, 9, 10 and 11. The fastest speeds recorded at Station C were :— Flood : 3-70 ft. per sec. at 2 fathoms depth at 2 and 24 hours before high water on Range IV. Ebb: 4-90 ft. per sec. on the surtace at 4 hours after high water on Range IV. The speeds of the current in all four ranges are high compared with those at most other stations owing to the narrowing of the river which occurs here. In addition, an old river bed joins the main channel on the south side about 2,500 ft. above Station C. This cut takes a large quantity of water from the channel, and combined with the narrowing of the channel, accounts for the high speeds recorded at C. On Range I the flood only flows for 4 hours on the surface and changes at 5 hours and 1 hour before high water. The maximum strength of the flood runs at the depth of 2 fathoms in each range. The “ waves”’ in the speed curves are very marked. Station D. Plates 12, 13, 14 and 15. The highest speeds recorded at Station D were :— Flood : 2-60 ft. per sec. at a depth of 2 fathoms at 24 hours before high water on Range IV. Ebb: 3-60 ft. per sec. on the surface at 4} hours after high water on Range IV. The weakness of the surface current on the flood compared with the sub- surface current is noticeable. The main strength of the flood runs at a depth of](https://iiif.wellcomecollection.org/image/b32179595_0001_0017.jp2/full/800%2C/0/default.jpg)



 No text description is available for this image
 No text description is available for this image
 No text description is available for this image