[Report 1966] / Medical Officer of Health, Ross-on-Wye U.D.C.
- Ross-on-Wye (England). Urban District Council.
- Date:
- 1966
Licence: Attribution 4.0 International (CC BY 4.0)
Credit: [Report 1966] / Medical Officer of Health, Ross-on-Wye U.D.C. Source: Wellcome Collection.
32/34 (page 4)
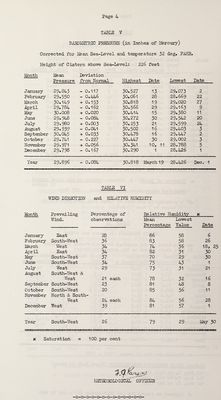
![TABLE V BAROMETRIC PRESSURE (in Inches of Mercury) Corrected for Ms an Sea-Level and temper ature 32 deg, FAHR. Height of Cistern above Sea-Level: 226 feet Month Mean Pressure Deviation from Normal Highest Date Lowest Date January 29.843 - 0.117 30.527 13 29.073 2 February 29.550 - 0.446 30.061 28 28.669 22 March 30.149 + 0.153 30.818 19 29.020 27 April 29.784 - 0.162 30.566 29 29.163 9 May 30.008 + 0.020 30.414 15 29.380 11 June 29.948 - 0.084 30.272 30 29.542 20 July 29.980 + 0.003 30,253 21 29.599 24 August 29.939 - 0.041 30.502 16 29.403 3 September 30.045 + 0.033 30.478 1.6 29.447 2 October 29.741 - 0.227 30.447 30 29.002 3 November 29.971 + 0.056 30.341 10, 11 28.788 5 December 29.798 - 0.167 30.290 1 28.426 1 Year 29.896 - 0.084 30.818 March 19 28.426 Dec. 1 TABLE VI WIND DIRECTION and RELATIVE HUMIDITY Month Prevailing Percentage of Relative Humidity X Wind. observations Mean Lowe st Percentage Value Date January East 28 86 58 6 February South-West 36 83 58 26 March West 34 74 36 18, 2] April East 34 82 31 30 May South-West 37 70 29 30 June South-West 34 75 43 1 July West 29 73 31 21 August South-West & West 21 each 78 32 16 September South-West 23 81 48 8 October South-West 20 85 56 11 November North & South- We st 24 each 84 56 28 December West 39 81 57 1 Year South-West 26 79 29 May 30 x Saturation = 100 per cent / -3' METEOROLOGICAL OFFICER](https://iiif.wellcomecollection.org/image/b3004165x_0032.jp2/full/800%2C/0/default.jpg)