Notes on some of the more common diseases in Queensland in relation to atmospheric conditions. 1887-1891 / Illustrated by charts prepared from information supplied by the Registrar-General's Department, and Chief Weather Bureau, Brisbane, including returns from the hospitals of the colony.
- Hardie, David
- Date:
- 1893
Licence: Public Domain Mark
Credit: Notes on some of the more common diseases in Queensland in relation to atmospheric conditions. 1887-1891 / Illustrated by charts prepared from information supplied by the Registrar-General's Department, and Chief Weather Bureau, Brisbane, including returns from the hospitals of the colony. Source: Wellcome Collection.
Provider: This material has been provided by the Augustus C. Long Health Sciences Library at Columbia University and Columbia University Libraries/Information Services, through the Medical Heritage Library. The original may be consulted at the the Augustus C. Long Health Sciences Library at Columbia University and Columbia University.
12/142 page 10
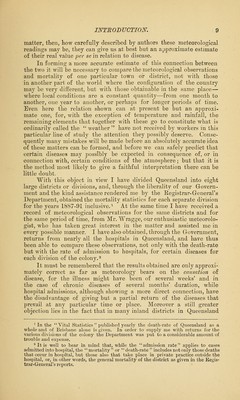
![the population is too small to supply, either from mortality or hospital statistics, a sufficiently large number of cases. In order to overcome this difficulty as far as possible, I have for Western Queensland taken the mean of the meteorological observations of two stations that are far apart such as Cloncurry and Hughenden, AVest Northern Queens- land; Bouliaaud Blackal],AVest Central Queensland; EomaandThargo- mindah, West Southern Queensland ; and in one case the mean of three stations, A^arwick, Toowoomba, and Dalby, as representing the Darling Downs. These are then made to represent, as they fairly do, the mortality and hospital returns of very much wider areas, and so give us a larger though perhaps less accurate basis to work upon. The same applies also to the other four divisions of the Colony, although here there is only one observing station for each district. It would have been well had this comparison extended back at least ten years instead of five, but it is doubtful whether the meteorological observations recorded previous to 1887, when Mr. Wragge arrived in the Colony, were as absolutely correct as those we now possess. It is also well to bear in mind that the population of Queensland increased from 322,853 in 1886 to 393,718 in 1891, and that consequently the total number of deaths—other things being equal—should increase in proportion from one year to another. The following are the observing stations and the districts they represent:— Observing Station. District Represented. 1. Brisbane That portion of Moreton District within 30 railes of the coast lying between the parallels 27 and 28 deg. S. 2. P»,oclchampton That portion of Port Curtis within 30 miles of the coast lying between the parallels 21 and 25 deg. S. 3. Cooktown That portion of the Cook District near the coast lying between the parallels 14 and 17 deg. S. 4. Normanton That portion of Burke inland from the Gulf of Carpentaria lying between 17 and 19 deg. lat. S. and 140 and 142 deg_. long. E. 5. Cloncurrry and Hughenden ... That portion of Burke lying between 20 and 21 deg. lat. S. and between 140 and 145 deg. long. E. 6. Boulia and Blackall That portion of North Gregory and Mitchell Districts lying between 22 and 25 deg. lat. S. and between 140 and 146 deg. long. E. 7. Roma and Thargomindah ... That portion of the Warrego and Maranoa Dis- tricts lying between 26 and 28 deg. lat. S. and between 143 and 149 deg. long. E. 8. Warwick, Toowoomba, Dalby That portion of the Darling Downs lying to the east of 151 deg. long. E.](https://iiif.wellcomecollection.org/image/b21219801_0012.jp2/full/800%2C/0/default.jpg)
 No text description is available for this image
 No text description is available for this image
 No text description is available for this image