Confidential enquiry into postneonatal deaths, 1964-1966.
- Great Britain. Department of Health and Social Security.
- Date:
- 1970
Licence: Public Domain Mark
Credit: Confidential enquiry into postneonatal deaths, 1964-1966. Source: Wellcome Collection.
73/76 (page 65)
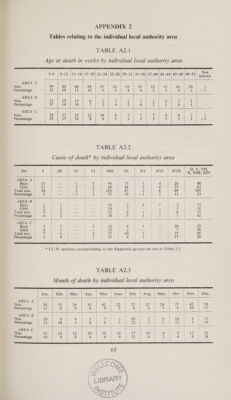
![Nos. Percentage AREA B Nos. Percentage AREA C Nos. Percentage 5-8 | 9-12 | 13-16) 17-20 | 21-24 | 25-28 | 29-32 | 33-36 | 37-40 | 41-44 | 45-48 99 80 66 44 35 24 12 19 12 15 16 23 18 is | 10 8 5 4 4 3 3 4 31 iI) 1S) 6 2 3 2 3 2, 1 bo) 37 18 18 U 2 4 2; 4 2 1 4 39 aE 2) 12 10 8 5 ij 7 8 4 25 17 16 8 6 5 3 5 5) 5 3 Not 49-52 known 10 1 2 <1 1 Paes 1 ee 2 1 1 <i | | 2 VEL Sex | I If] IV VI Vill | 1X xXxV XVI XVIT X, XII, XIV “AREA A- | | Nag it ; Boys 13 — 1 5 94 | 37 1 | 4 26 40 Girls 11 — 1 2 68° | 46 1 | + 23 63 Total nos. 24 — i | i | 162 83 2 8 49 103 Percentage > —— <a 2 37 19 <1 2 it 23 AREA B | | | (aa ae | | | Boys i 1 | —~ | = 18 2 1 1 See 13 Girls ae | ee 14 2 — =, Sea | 20 Total nos, 3 carl a) ie 32. | 4 i 1 ea 35 Percentage 4 | Dy Nese i 38 5 1 | 1 if. | 42 AREA C | | | | | | | Boys | 3 Be al 5 = Dee hese 8 1 — 20. | 25 Girls 4 SF OE ae EDD) 2 — ae ae NG 20 Total nos. | ot Oe | Sole - 2S! «0 ae eee te ee lee 45 Percentage 5 Lie pei) Nee | | ro is Gr ina ea aes | yi 29 | *1.C.D. sections corresponding to the diagnostic groups set out in Table 3.2. TABLE A2.3 Month of death by individual local authority area ) Jan Feb. Mar. | Apr. May | June July Aug. | Sept. Oct. Nov Dec AREA A | | | os. 56 35 38 35 42 2, 25 2S 24 37 43 58 Percentage iB 8 9 8 9 5 6 6 5 8 10 13 AREA B ee ee ee ew = | Nos. 10 8 4 5 et 3 10 2 6 10 | 4 {5 Percentage Z 10 5 6 8 3 12 2 W | 12 5 18 AREA C | ; a 4 | Percentage 14 9 8 6 6 y) 11 6 yy 6 8 14 ee ee ee Se SE eS](https://iiif.wellcomecollection.org/image/b32183513_0073.jp2/full/800%2C/0/default.jpg)