Annual report of the Director of Public Health for the Government of Bombay.
- Bombay (India : State). Public Health Department.
- Date:
- [1936]
Licence: Public Domain Mark
Credit: Annual report of the Director of Public Health for the Government of Bombay. Source: Wellcome Collection.
44/220 (page 26)
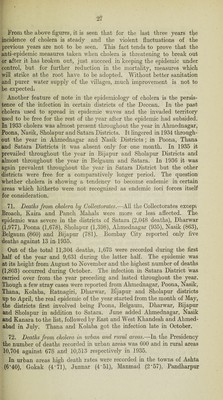
![^6 67. Deaths from child-birth in urban areas.—In Bombay City the rat of maternal mortality was 1 to 193 births against 1 to 174 in 193« Among other towns high rates were reported from Viramgaum 1 to 2' Dakore 1 to 34, Guledgud 1 to 34, Bhusawal 1 to 45, Jalgaon 1 to 5' Gokarn 1 to 57 and Broach 1 to 62. 68. Diphtheria.—There were 43 deaths reported from this disea: during the year against 21 in 1935. All the deaths were reported fro. the Central Registration District out of which 32 occurred in rural are; and 11 in urban areas. By towns the number of deaths recorded we; Poona 5, Nasik 4 and Ahmednagar 2. 69. The number of deaths from chief causes for each Collectors and by months is shown in Annual Forms Nos. VII to XII. CHAPTER IV. Epidemiology. Cholera. (General Prevalence.) 70. The number of deaths from cholera was almost the same durii the year as compared with 1935. There were 11,304 deaths in 19. against 11,191 in 1935 and 10,052 the quinquennial mean. The deat rate was *63 against *62 in 1935 and *57 the quinquennial mean. Tj urban and rural death-rates for the Presidency were *16 and respectively against ’19 and ’70 in the preceding year. Cholera prevailed, in 147 registration circles and 1,979 villages compared with 144 and 1,890 respectively in 1935 and the ratio of deat per 1,000 of population in affected towns and villages was 2’95. T case mortality rate during the year was 48’56. The following table gives the deaths recorded in previous years sin; 1911 _J Year. Number of deaths. Year. a Number c deaths. 1911 5,808 1924 7,82' 4912 57,789 1925 5i 1913 5,108 1926 7. 26,02<| 1914 17,778 1927 1915 350 1928 6,66] 1916 18,610 1929 2,67 1917 16,554 1930 15,14: 1918 8,832 1931 18,57 1919 51,235 1932 1,33 1920 2,047 1933 7,79 1921 3,092 1934 11,36 1922 2,743 1935 11,19 1923 9,212 1936 11,30 Distribution—Vide Annual Form No. VII.](https://iiif.wellcomecollection.org/image/b31405320_0044.jp2/full/800%2C/0/default.jpg)