[Report 1898] / Medical Officer of Health, Dartford U.D.C.
- Dartford (England). Urban District Council.
- Date:
- 1898
Licence: Attribution-NonCommercial 4.0 International (CC BY-NC 4.0)
Credit: [Report 1898] / Medical Officer of Health, Dartford U.D.C. Source: Wellcome Collection.
1/14
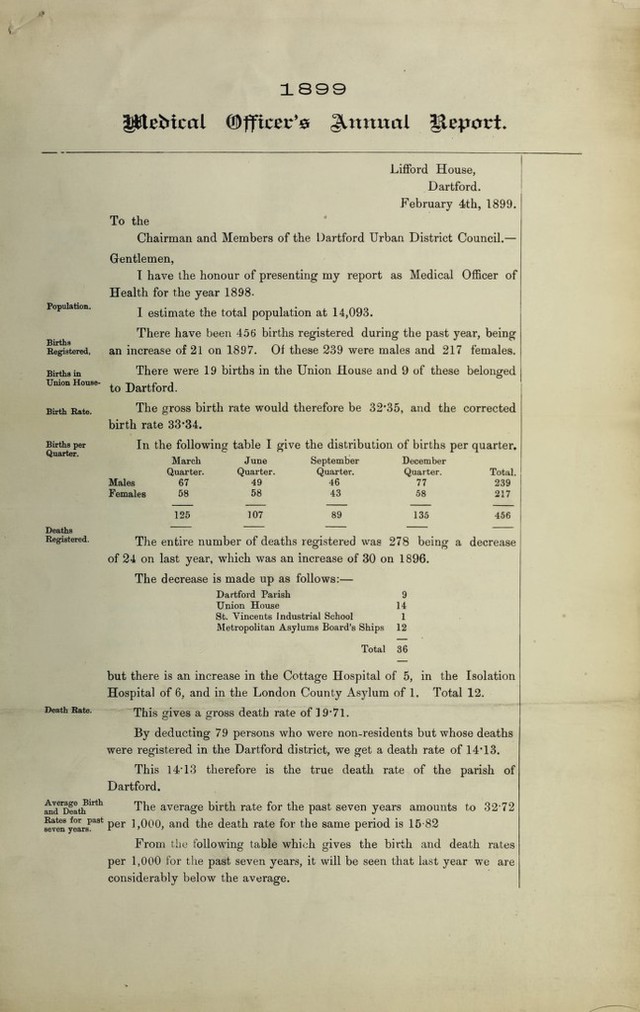
![1800 Population. Births Registered, Births in Union House- Birth Rate. Births per Quarter. Deaths Registered. Death Rate. Average Birth and Death Rates for past seven years. pieiiical ©fficec’e glrmual l^eport. Lifford House, Hartford. February 4th, 1899. To the Chairman and Members of the Dartford Urban District Council.— Gentlemen, I have the honour of presenting my report as Medical Officer of Health for the year 1898- 1 estimate the total population at 14,093. There have been 4.56 births registered during the past year, being an increase of 21 on 1897. Of these 239 were males and 217 females. There were 19 births in the Union House and 9 of these belonged to Hartford. The gross birth rate would therefore be 32*35, and the corrected birth rate 33*34. In the following table I give the distribution of births per quarter. Males Females March Quarter. 67 58 June Quarter. 49 58 September Quarter. 46 43 December Quarter. 77 58 Total. 239 217 125 107 89 135 456 The entire number of deaths registered was 278 being a decrease of 24 on last year, which was an increase of 30 on 1896. The decrease is made up as follows:— Dartford Parish 9 Union House 14 St. Vincents Industrial School 1 Metropolitan Asylums Board’s Ships 12 Total 36 but there is an increase in the Cottage Hospital of 5, in the Isolation Hospital of 6, and in the London County Asylum of 1. Total 12. This gives a gross death rate of ] 9*71. By deducting 79 persons who were non-residents but whose deaths were registered in the Dartford district, we get a death rate of 14*13. This 14*13 therefore is the true death rate of the parish of Dartford. The average birth rate for the past seven years amounts to 32*72 per 1,000, and the death rate for the same period is 15-82 From the following table which gives the birth and death rates per 1,000 for the past seven years, it will be seen that last year we are considerably below the average.](https://iiif.wellcomecollection.org/image/b29150711_0001.jp2/full/800%2C/0/default.jpg)