[Report 1952] / Medical Officer of Health and School Medical Officer of Health, East Riding of Yorkshire County Council.
- East Riding of Yorkshire (England). County Council
- Date:
- 1952
Licence: Attribution 4.0 International (CC BY 4.0)
Credit: [Report 1952] / Medical Officer of Health and School Medical Officer of Health, East Riding of Yorkshire County Council. Source: Wellcome Collection.
80/96 (page 76)
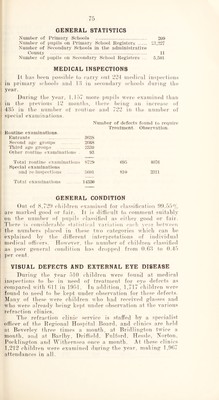
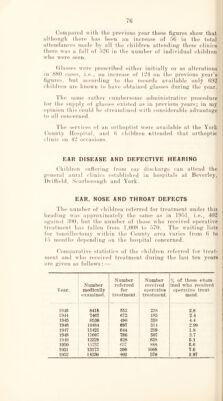
![Coni]>are(l with the ])revious year these figures show that althoiig'li tliere lias been an increase of 5G in the total attendances made by all the (diildren attending' these clinics there was a fall of 526 in the number of individual children who were seen. (ihisses were prescrihed either initially or as alterations in 8(S() cases, i.e., an im-rease of 124 on the previous year’s figures, hut according to the records available only 692 children are 1 uiown lo have obtained glasses during the year. The same rathei' cumbersome administrative procedure for the supidy of glasses existed as in picvious years; in my oj)inion this could la* streamlined with considerable advantage to all concerned. 'The servi(‘es of an orthojitist were available at the York (!hunty llosjiital, aiul 6 childien nttended that orthopti/c clinic on 42 occasions. EAR DISEASE AND DEFECTIVE HEARING (diildren suffering from ear discharge can attend the general aui'al (diniiis established in hos])itals at Beverley, Driffield, Scarborough and York. EAR, NOSE AND THROAT DEFECTS The number of children referred for treatment under this i heading was apjiroximately the same as in 1951, i.e., 402 against df)t), but the number of those who received ojierative treatment has fallen from 1,()()(S to 570. The waiting lists I for tonsillectoniv within the Countv area varies from 6 to ; t t 15 months dejiending on the liosjiital concerned. (nmparative statistics of the (diildren referred for treat- ment and who received treatment during the last ten years i are given as follows: — Year. Number medically examined. Number referred for treatment. Number received oiierntive treatment. % of those exam- ined who received operative treat- ment. 194S 8415 552 238 2.8 1944 7467 672 185 2.4 1945 8530 490 358 4.4 1946 10484 697 314 2.99 1947 11421 644 219 1.8 1948 13607 786 507 3.7 1949 12329 628 638 5.1 1950 15737 637 888 5.6 1951 13173 390 1008 7.6 1952 14330 402 570 8.97](https://iiif.wellcomecollection.org/image/b29185609_0082.jp2/full/800%2C/0/default.jpg)