Report on the sanitary administration of the Punjab and proceedings of the Sanitary Board for the year ... and the report on sanitary works for.
- Punjab (India). Sanitary Board.
- Date:
- [1908]
Licence: Public Domain Mark
Credit: Report on the sanitary administration of the Punjab and proceedings of the Sanitary Board for the year ... and the report on sanitary works for. Source: Wellcome Collection.
41/86 (page 27)
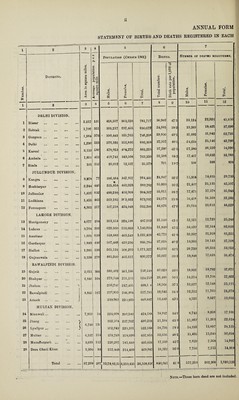
![STATEMENT SHOWING THE BIRTHS REGISTERED IN THE DISTRICTS OF THE PUNJAB DURING THE YEAR 1908. 1 2 3 4 5 6 7 8 9 1 0 Population according to Census of 1901.* Number of births Registered. Ratio of BIRTHS PER 1,000 OF POPULATION. qa > © o -M a L* GO a & a © . ■d p c fn * U, ao g k s . c U C © -3 ► cc Mean Ratio OF BIRTHS PER 1,000 DURING PREVIOUS FIVE YEARS. u © & £ H z Districts. j Males. Females. wT3 -+-> o H QQ <X *3 a 1 1 Females. 1 Total. Males. Females. Total. Number of males bo 100 females born. Excess of births o‘ per 1,000 of popu' ® S 5 p- I's o U-. O e C- 2^ © u © a >1 P W Males, j Females. Tetal. © _Q a a 1 2 3 4 5 6 7 8 9 10 11 12 13 14 15 16 17 18 1 iDELHI DIVISION, Hiesar ... ••• •«» 418,167 363,550 781,717 19,223 17,739 36,962 24 6 227 473 1087 117 223 207' 43-0 1 2 Rohtak ... 333,217 297,455 630,672 12,683 11,379 24,065 20-1 18-0 38 2 111*5 21-6 209 19* L 40-0 2 3 Gnrgaon ... 390,443 355,765 746,208 15,724 14,226 29,950 211 197 407 110-5 ... 44-0 222 20-2 42-4 3 4 Delhi 370,103 316,895 686,998 14,245 13,312 27,557 20-7 197 40 1 107-0 • • • 32-4 22 3 239 432 4 5 Karnal ... 478,953 404,272 883,225 19,668 17,912 37,580 22-3 20-3 42-5 109‘X ... 18-7 2L-8 19-7 41-5 5 6 Ambala. 419,742 343,508 763,250 13,624 12,484 26,108 17'8 164 34-2 109-1 10-5 19-0 17*3 36-4 6 7 Simla mi 23,012 12,567 35,579 372 329 701 10-5 92 197 113-1 ••• 5-4 103 93 19-6 7 8 JULLUNDDR DIVISION. Kangra. 396,484 367,957 764,441 12,611 12,036 24,647 16-5 157 32-2 104-8 • •• 6-7 18-9 176 36-5 8 9 Hoshiarpnr . 525,854 463,928 989,782 18,482 17,371 35,853 18'7 17-6 36-2 106-4 • • • 68 21 3 19 b 40-9 9 10 Jullundnr ... ... 488,299 416,008 904,307 18,103 16,908 35,011 200 187 38‘7 107-1 • • • 07 21-0 19-6 40-6 10 11 LudhiaDa... ... ... 369,165 303,932 673,097 12,483 11,590 24,073 18-5 17-2 35*8 107-7 • • • 12 6 20*1 18 8 39-0 11 12 Ferozepore 507,258 424,948 932,206 23,334 21,342 44,676 250 22-9 47’9 109-3 • • > 43 23-6 21*1 44-7 L3 13 LAHORE DIVISION. Montgomery . 263,354 224,598 487,952 11,030 10,119 21,149 22-6 207 43'3 1090 ... 8’4 229 20-4 43-3 U 14 Lahore m ••• ••• 629,360 516,669 1,146,029 27,178 24,671 51,849 237 215 452 110-2 . •• 12-9 23 8 217 453 u 15 Amritsar ... ... 558,889 463,549 1,022,438 22,220 20,553 42,773 217 207 41-8 108’1 • • • 22 0 237 217 44-2 L5 16 Gurdaspnr . 507,488 429,296 936,784 19,581 18,037 37,618 20-9 19-3 40-2 108-6 0-2 • • • 22-8 21 1 43-9 16 17 Sialkot . 565,124 506,203] 1,071,327 23,456 21,637 45,093 219 20-2 42-1 108-4 ... 7-4 24*9 23 2 48-0 17 18 Gujranwala . 485,260 405,317 €90,577 18,385 16,652 35,037 20'6 187 393 110-4 • • • 17 22-3 19-9 42 2 18 19 RAWALPINDI DIVISION. Gujrafc ••>• ••• ••• 389,402 361,146 750,518 15,667 14,362 30,029 209 197 40-0 109-1 10-2 23 4 2D4 44 9 L9 20 Shahpur ... 273,144 251,115 524,259 14,012 12,474 26,486 267 238 505 1123 . » • 2-8 22-S 20-3 43-1 20 21 Jhelum ... 250,741 247,435 498,176 9,870 8,696 18,566 19-8 17-5 37’3 113 5 «.. 132 20-5 18-1 38-9 21 22 Rawalpindi ... ... 270,855 246,906 517,761 9,599 8,446 18,045 18-5 163 349 1137 ... 12-t 19-8 18-1 37-8 22 23 Attock ••• ••• 239,962 220,935 460,897 10,266 9,233 19,499 22 3 20-0 423 111*2 1*0 • • • 22-6 20-1 42*7 23 24 MULTAN DIVISION. Mianwali... 224,008 200,580 424,588 10,077 8,860 18,937 237 20-9 44-6 1137 4-3 ... 22-9 200 429 24 25 Jhang . 262,504 227,762 490,266 11,164 9,940 21,104 22-8 CO b 43-0 112-3 ... 3 2 21-3 18-9 40*2 25 26 Lyallpar ••• ••• 302,043 220,101 522,144 20,115 18,681 38,796 38-5 35-8 743 107-7 207 • •• 332 29-9 63 2 26 27 Multan ••• »M 379,769 318,090 697,839 17,716 I 15,920 33,636 257 22*8 48-2 111*3 43 1 * * * 24-4 222 46’6 2* 28 Mazaffargarh . 220,207 185,449 405,656 9,313 8,026 17,339 230 19-8 427 1160 5-7 ... 221 19-4 41-6 28 29 Dera Ghazi Khan 255,448 214,499 469,947 9,335 7,587 1 16,922 19-9 167 36-( 1230 4-2 18-4 15 3 337 29 Total 10,798,255 9,310,43 20,108,690 439,539 400,522 840,061 219 19S 41S 103*7 ... 8-9 22-3 203 426 ; -- . * Excluding population of Military Cantonments.](https://iiif.wellcomecollection.org/image/b31489357_0041.jp2/full/800%2C/0/default.jpg)