Rural depopulation / by G. B. Longstaff.
- Longstaff, George Blundell, 1849-1921.
- Date:
- 1893
Licence: Public Domain Mark
Credit: Rural depopulation / by G. B. Longstaff. Source: Wellcome Collection.
Provider: This material has been provided by London School of Hygiene & Tropical Medicine Library & Archives Service. The original may be consulted at London School of Hygiene & Tropical Medicine Library & Archives Service.
27/68 page 25
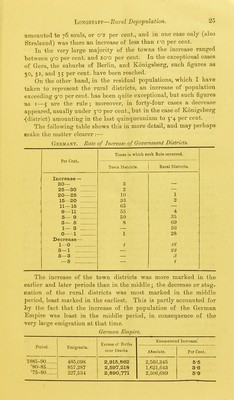
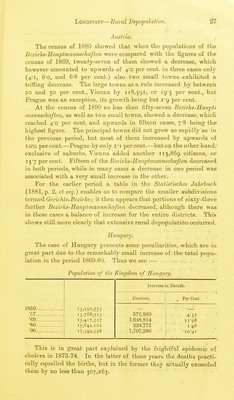
![amounted to 76 souls, or 0*2 per cent., and in one case only (also Stralsund) was there an increase of less tlian i-o per cent. In the very large majority of the towns the increase ranged between 9*0 per cent, and 20-0 per cent. In the exceptional cases of Gera, the suburbs of Berlin, and Konigsberg, such figures as 30, 32, and 35 per cent, have been reached. On the other hand, in the residual populations, which I have taken to represent the rural districts, an increase of population exceeding 9-0 per cent, has been quite exceptional, but such figures ^is I—5 are the rule ; moreover, in forty-four cases a decrease appeared, usually under 3-0 per cent., but in the case of Konigsberg ■(district) amounting in the last quinquennium to 5*4 per cent. The following table shows this in more detail, and may perhaps make the matter clearer:— Germany. Mate of Increase of Government Districts. Per Cent. Times in which such Rate occurreil. Town Districts. Bural Districts. Increase — 30— 3 25—30 2 20—25 10 1 15—20 33 2 11—15 65 9—11 55 4> 5— 9 50 35 3— 5 8 69 1— 3 56 0— 1 1 28 Decrease— 1-0 ^S 3 — 1 22 6—3 3 — 5 4 The increase of the town districts was more marked in the earlier and later periods than in. the middle; the decrease or stag- cation of the rural districts was most marked in the middle period, least marked in the earliest. This is partly accounted for by the fact that the increase of the population of the German. l]]mpire was least in the middle period, in consequence of the very large emigration at that time. German Empire. Period. Emigrants. Excess of Births over Ueiillja Enunieriited Increase. Absolute. Per Cent. 1885-90 '80-85 '75-80 485,098 857,287 227,534 2,915,862 2,597,218 2,890,771 2,566,345 1,621,643 2,506,689 5-5 3-6 5-9](https://iiif.wellcomecollection.org/image/b24399012_0027.jp2/full/800%2C/0/default.jpg)