[Report 1929] / Medical Officer of Health, Halifax County Borough.
- Halifax (England). County Borough Council. nb2008024085.
- Date:
- 1929
Licence: Attribution 4.0 International (CC BY 4.0)
Credit: [Report 1929] / Medical Officer of Health, Halifax County Borough. Source: Wellcome Collection.
79/82
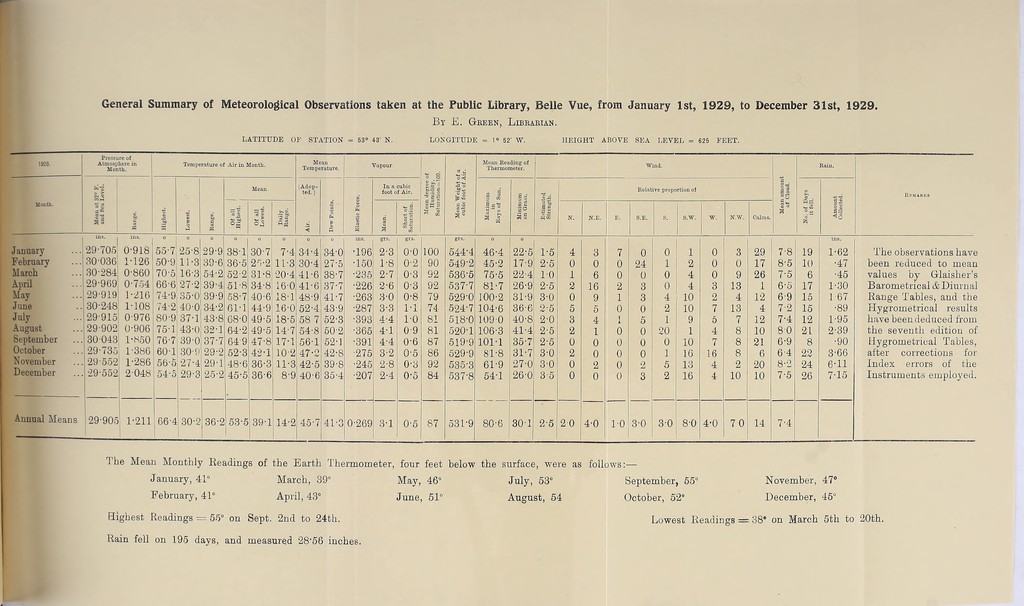
![General Summary of Meteorological Observations taken at the Public Library, Belle Vue, from January 1st, 1929, to December 31st, 1929. By E. Green, Librarian. LATITUDE OF STATION = 63° 43' N. LONGITUDE = 1° 52' W. HEIGHT ABOVE SEA LEVEL = 625 FEET. 1928. Pressure of Atmosphere in Month. Temperature of Air in Month. Mean Temperature. Vapour. aj • Mean Reading of Thermometer. Wind. Rain. Mean. (Adop- ted. ) In a cubic foot of Air. iffi •S'l’-g 5 3 d . ra Relative proportion of l| a° & Remarks Month. si Range. Highest. Lowest. Range. Of all Highest. Of all Lowest. Daily Range. < | £ g « Elastic Fore S Short of Saturation. Jw | si flS .l.g o 1 | f! a§ ji N. N.E. E. S.E. S. s.w. W. N.W. Calms. §° £ 3 -g is <8 January 29-705 0-918 55-7 25-8 29-9 38-1 30-7 7-4 34-4 34-0 ins. •196 grs. 2-3 grs. o-o 100 grs. 544-4 46-4 22-5 1-5 4 3 7 0 0 1 0 3 29 7-8 19 ins. 1-62 The observations have February 30-036 1-126 50-9 11-3 39-6 36-5 25-2 11-3 30-4 27-5 •150 1-8 0-2 90 549'2 45-2 17-9 2-5 0 0 0 24 1 2 0 0 17 8-5 10 •47 been reduced to mean March 30-284 0-860 70-5 16-3 54-2 52-2 31-8 20-4 41-6 38-7 •235 2-7 0-3 92 536-5 75-5 22-4 10 1 6 0 0 0 4 0 9 26 7-5 6 •45 values by Glaisher’s April 29-969 0-754 66-6 27-2:39-4 51-8 34-8 16-0 41-6 37-7 •226 2-6 0-3 92 537-7 81-7 26-9 2-5 2 16 2 3 0 4 3 13 1 6-5 17 1-30 Barometrical & Diurnal May 29-919 1-216 74-9 35-0 39’9 58-7 40-6 18-1 48-9 41-7 ■263 3-0 0-8 79 529-0 100-2 31-9 3-0 0 9 1 3 4 10 2 4 12 6-9 15 1-67 Range Tables, and the June 30-248 1-108 74-2 40-0] 34-2 61-1 44-9 16-0 52-4 43-9 •287 3-3 1-1 74 524-7 104-6 36-6 2-5 5 5 0 0 2 10 7 13 4 7-2 15 •89 Hygrometrical results July 29-915 0-976 80-9 37-1 43-8 68-0 49-5 18-5 58 7 52-3 •393 4-4 1-0 81 518-0 1090 40-8 2-0 3 4 1 5 1 9 5 7 12 7-4 12 1-95 have been deduced from August 29-902 30 043 0-906 75-1 43-0 32-1 64-2 49-5 14-7 54-8 50-2 •365 4-1 0-9 81 520-1 106-3 41-4 2-5 2 1 0 0 20 1 4 8 10 80 2L 2-39 the seventh edition of September 1-K50 76-7 39-0 37-7 649 47-8 17-1 56-1 52-1 ■391 4-4 0-6 87 519-9 101-1 35-7 2-5 0 0 0 0 0 10 7 8 21 6-9 8 •90 Hygrometrical Tables, October 29'735 1-386 60-1 30-9 29-2 52-3 42-1 10-2 47-2 42-8 •275 3-2 0-5 86 529-9 81-8 31-7 3-0 2 0 0 0 1 16 16 8 6 6-4 22 3-66 after corrections for November 29-552 1-286 56-5 27-4 29-1 48-6 36-3 11-3 42-5 39-8 •245 2-8 0-3 92 535-3 61-9 27-0 3-0 0 2 0 2 5 13 4 2 20 8-2 24 6-11 Index errors of the December -29-552 2048 54-5 29-3 25-2 45-5 36-6 8-9 40-6 35-4 •207 2-4 0-5 84 537-8 54-1 26-0 3-5 0 0 0 3 2 16 4 10 10 7-5 26 7-15 Instruments employed. Annual Means 29-905 1-211 66-4 80-2 36-2 53-5 39-1 14-2 45-7 41-3 0-269 3-1 0-5 87 531-9 80-6 30-1 2-5 20 4-0 1-0 3-0 3-0 8-0 4-0 70 14 7-4 The Mean Monthly Readings of the Earth Thermometer, four feet below the surface, were as follows January, 41° March, 39° February, 41° April, 43° Highest Readings = 55° on Sept. 2nd to 24th. Rain fell on 195 days, and measured 2856 inches. May, 46° June, 51° July, 53° August, 54 September, 55° November, 47° October, 52° December, 45° Lowest Readings = 38° on March 5th to 20th.](https://iiif.wellcomecollection.org/image/b29406262_0081.jp2/full/800%2C/0/default.jpg)