Annual public health report of the Province of Bihar; and Annual vaccination report.
- Bihar (India). Public Health Department.
- Date:
- [1937]
Licence: Public Domain Mark
Credit: Annual public health report of the Province of Bihar; and Annual vaccination report. Source: Wellcome Collection.
111/146 (page 103)
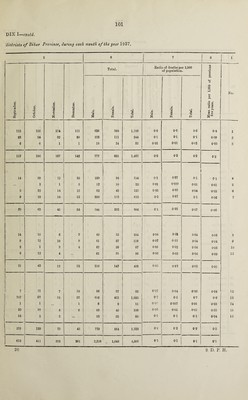
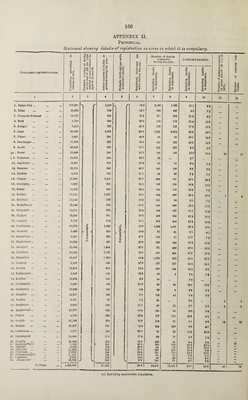
![DIX I—conid. districts of Bihar Province, during each month of the year 1937. 6 7 8 1 4^ m < September. October. 1 November. December. Total. Ratio of deaths per population. 1,000 of Mean ratio per 1,000 of previous five years. No Male. Female. Total. Male. Female. 1 1 Total. i 102 86 104 147 203 747 619 1,396 0-7 07 0*7 0*5 1 11 11 15 17 24 105 71 176 0'09 006 0*07 0*07 2 2 3 1 2 6 18 13 31 002 0*01 0*01 0*03 3 115 100 120 166 233 870 733 1,603 0-3 0*2 0*2 0*2 67 56 58 53 101 451 279 730 0-3 0*2 0*2 0*3 4 3 1 3 4 ... 19 17 36 001 0*01 0*01 0006 5 4 4 7 9 12 38 40 73 0-02 0*02 0*02 0*03 6 4 3 4 13 8 62 31 93 0-03 0*01 0*02 0*02 7 00 l> 64 72 79 121 570 367 937 01 0*07 0*08 0*08 1 3 3 11 6 41 24 65 0-03 002 0*03 0*03 8 6 4 4 5 5 43 24 67 0*03 002 003 0*04 9 3 2 3 5 2 28 10 38 002 0*009 002 0*01 10 16 24 14 26 21 176 CO 236 02 0*05 0 1 0*1 11 20 33 24 47 34 288 118 406 006 0*03 0*05 0*05 7 5 3 4 6 42 17 59 005 0*02 0*03 0C3 12 9 6 3 3 1 48 19 67 0 06 0*02 004 0*04 13 Ml • •• Ml ... ... 2 1 3 0*005 0*002 0*004 0*01 14 14 17 11 15 22 151 65 216 02 0*1 0*1 0*1 15 5 1 3 ... ... 8 7 ]5 002 003 0*02 0*03 16 85 29 20 22 29 251 109 360 0 08 0 03 0*05 0*05 254 226 236 314 417 1,979 1,327 3,306 0*1 008 01 0*09](https://iiif.wellcomecollection.org/image/b31478219_0111.jp2/full/800%2C/0/default.jpg)