On the influence of weather upon disease and mortality / by R.E. Scoresby-Jackson.
- Robert Scoresby Jackson
- Date:
- 1863
Licence: Public Domain Mark
Credit: On the influence of weather upon disease and mortality / by R.E. Scoresby-Jackson. Source: Wellcome Collection.
42/80 (page 34)
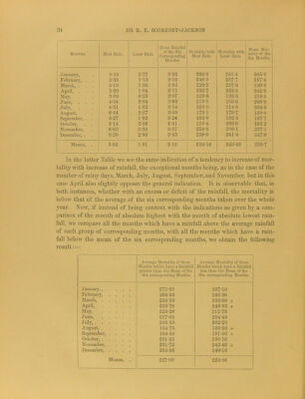
![1 Months. Most Ruin. Least Rain. Moan Rniiifall of the Six Corresponding Months. Mortality with Most Uuin. Mortality with Least Rain. Mean Mor- 1 Ittlity of the Six Months. 1 Jmiuarv, 6’32 2-77 3-82 290-C 253-2 265-3 ; ! Febru.arv, . 3-38 113 2*32 24(i-9 237-7 257-4 ^larch, . 6-10 1-95 3-66 220-2 257-8 249-8 April, . 3-20 104 211 222-7 223-5 242-8 May, . . . 3-89 0-29 2-07 228-4 193-5 219-5 June, 4-34 2-04 2-98 219 1 188-6 208-6 Julv, 4-31 1-82 3-14 224 0 214-8 204-5 August, . . 6-44 2-27 3-39 173-1 178-7 189-4 September, . . 6-27 1-92 3-24 165-0 182-5 187-7 October, 5-14 2-36 4'41 2104 208-0 198-2 November, 6-63 2-38 3'37 224-5 266-1 237-1 i December, . 6-20 2-98 3-85 259-0 241-4 247-9 j Means, 5-82 1-91 318 224-16 220-49 225-7 1 in the latter Table we see the same indication of a tendency to increase of mor- tality with increase of rainfall, the exceptional months being, as in the case of the number of rainy days, March, July, August, September, and November, but in this case April also slightly opposes the general indication. It is observable that, in both instances, whether with an excess or deficit of the rainfall, the mortality is below that of the average of the six corresponding months taken over the whole year. Now, if instead of being content with the indications as given bj^ a com- ])arison of the month of absolute highest with the month of absolute lowest rain- fall, we compare all the months which have a rainfall above the aA^erage rainfall of each group of corresponding months, with all the months which have a rain- fall beloAv the mean of the six corresponding months, we obtain the following result:— Average Mortality of those Months which have a Rainfall greater than the Mean of the Six corresponding Months. Average Mortality of those Months wliich have a Rainfall less than the Mean of the Six corresponding Months. January, 273-60 257-10 February, .... 268-53 246-36 March 236-30 263-66 + April, 238-76 246-93 + May, 226-26 212-73 June 217-05 204-40 July, 206-90 202-20 August, 184-75 198-60 + September, .... 184-60 191-00 + October, 201-23 195-16 November, .... 231-72 242-46 + December, .... 255-66 240-16 Means, . 227-09 225-06](https://iiif.wellcomecollection.org/image/b28142081_0042.jp2/full/800%2C/0/default.jpg)