An investigation on the fate of organic and inorganic wastes discharged into the marine environment : and their effects on biological productivity.
- California. State Water Quality Control Board
- Date:
- 1965
Licence: Public Domain Mark
Credit: An investigation on the fate of organic and inorganic wastes discharged into the marine environment : and their effects on biological productivity. Source: Wellcome Collection.
39/134 page 25
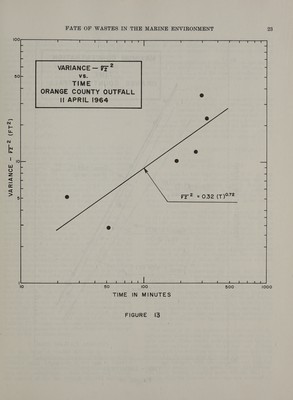
![for different diffusion times and thus to fit a theoretical curve to the observed points. Figure 15 shows the re- sults obtained by this method of analysis. A diffusion velocity of 1.7 ft/min. appeared to give the best com- parison between observed and theoretical curves. The value of P for this test agrees favorably with those determined for other experiments, as well as with those given by Joseph and Sender in their original paper (8) for diffusion on a much larger scale. Assuming a value of P equal to that determined above, it is possible to compare the observed and theo- retical values of Cnax for the data of 11 April. Assuming an average surface dye layer thickness of 10 ft. as be- fore, and setting r = 0 in equation (8), we have: m’ Gos = 2 2PHt Oi 429(T)-2 The results of this analysis are also shown in Figure 14. It can be seen that for this particular experiment the model proposed by Joseph and Sender gives results that compare reasonably well with the observed maximum concentrations. It must be emphasized that models similar to equation (8) and (9) are derived on the as- sumption that the turbulence is horizontally isotropic. Therefore, these models cannot be expécted to describe accurately the spatial distribution of dye in which the turbulence is wholly or in part anisotropic. This can best be seen in Figure 16 where the actual and estimated dye distribution is shown for the data of 17 August approximately 110 minutes after dye release. In connection with the models just described, it is interesting to speculate further on the assumption of horizontal anisotropy. Ichye (13) reports that the elongation of dye patches can be the result of both anisotropic conditions as well as “shear effect’? due to the existence of a velocity gradient with depth. He states that photographs of dye patches were observed to form a narrow ‘“‘tail’’ of dye, at depth, which he attributes to a vertical velocity differential. In the ex- periments conducted by the Allan Hancock Foundation, the underway sampler normally was set at a depth of 0 to a maximum of about 2 feet. At those shallow depths (which can be considered essentially surface sampling) the length of the dye patch was usually much greater than the width. This is shown in Figures 8 and 9. This fact does not preclude the effects of a vertical velocity gradient in the thin upper layers of the water surface, but at least gives some substance to the assumption of horizontal anisotropy. If shear is important, its effect is included in the measured values of o7,,, shown in Table 5. Field measurements and analytical techniques devised to separate the shear effect from true anisotropy must be left for future study. 7. MASS BALANCE ANALYSIS In any study of relative diffusion it is necessary periodically to re-estimate the amount of dye remaining within a patch. An analysis of this type is termed a “mass or materials balance.’”” Depending on the accu- racy of the calculations, a mass balance may indicate the amount of dye lost through physical adsorption, photochemical decay, or other factors. In Pearson’s (14) review of tracer methodology, he points out the im- portance of such estimates in diffusion studies utilizing artificial tracers. In the present experiments the amount of dye was re- estimated by calculating M in equation (2) using ob- served values of Cmax and the empirical values of the variances at different time periods. Thus we have: M’ = CpaxtV/2r [525 y25,? ]/ (10) Where M (referred to as M’) is in pounds and the units of Cmax are lb/ft. Obviously M’ computed by this method is a function of the diffusion time as long as the slopes of the curves for the observed and calculated values of Cmax are not parallel. Therefore, for purposes of comparison, the average value of the diffusion time was used in all mass balance calculations. Applying this method of analysis to the data collected on 11 April yields: M’ = [4.66 X 10⁻⁴] (684(T)—!-® ] [17.2(T)?-9!] OL Os At T = 150 minutes: M’ = 6.08 (Ib) = 122% recovery It is seen that for this experiment M’ > M, or that more dye was recovered at 150 minutes than was orig- inally released. The discrepancy possibly can be ac- counted for by induced errors in sampling technique or by increased indicated fluorescence levels due to the presence of particulate matter indigenous to the waters within a waste field. Table 5 summarizes the calculated values of M’ for all dye patch studies. The indicated values range from 40 to 244 percent. Bowles et al. (15), in their studies of the diffusion characteristics of fluorescein in the English Channel, reported mass balances ranging from 35 to 304 percent. They speculated that the higher values of M’ were probably due to the presence of particulate matter. Pritchard and Carpenter (8), in their study of diffusion in Chesapeake Bay, reported that mass balances of 80 to 90 percent were realized using rhodamine B as a tracer. It is interesting to note that the higher values of M’ indicated in Table 5 correspond to experiments carried out within the waste field. The higher concentration of particulate matter in these waters could have been re- sponsible for the higher indicated recoveries. However, when one considers the initial dilution at the boil (values for these experiments ranged from 7/1 to 20/1.) plus the rapid dilution as the field moves downstream, it is not likely that particulate matter was a serious prob- lem. This is confirmed by transparency measurements taken in the field. The values of M’ for experiments conducted in the background sites outside the waste field ranged from 37 to 78 percent. These waters were characterized by rela- tively low natural turbidity. In all but one of these experiments the stabilities were much lower than that observed in the waste field at Orange County. The rate of vertical diffusion, with one exception, was observed to be much greater in these areas. Deeper dye penetra- tion made vertical sampling more difficult, and it is possible that the observed data were less accurate for](https://iiif.wellcomecollection.org/image/b32172370_0039.jp2/full/800%2C/0/default.jpg)