[Report 1968] / Medical Officer of Health, Monmouthshire County Council.
- Monmouthshire County Council
- Date:
- 1968
Licence: Attribution 4.0 International (CC BY 4.0)
Credit: [Report 1968] / Medical Officer of Health, Monmouthshire County Council. Source: Wellcome Collection.
21/136 page 17
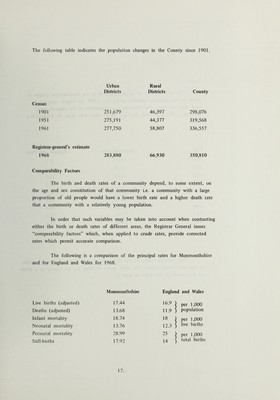
![The following table indicates the population changes in the County since 1901. Urban Districts Rural Districts County Census 1901 251,679 46,397 298,076 1951 275,191 44,377 319,568 1961 277,750 58,807 336,557 Registrar-general’s estimate 1968 283,880 66,930 350,810 Comparability Factors The birth and death rates of a community depend, to some extent, on the age and sex constitution of that community i.e. a community with a large proportion of old people would have a lower birth rate and a higher death rate that a community with a relatively young population. In order that such variables may be taken into account when contrasting either the birth or death rates of different areas, the Registrar General issues “comparability factors” which, when applied to crude rates, provide corrected rates which permit accurate comparison. The following is a comparison of the principal rates for Monmouthshire and for England and Wales for 1968. Monmouthshire England and Wales Live births (adjusted) 17.44 16.9 j per 1,000 Deaths (adjusted) 13.68 11.9 j 1 population Infant mortality 18.74 18 i ! Per 1,000 Neonatal mortality 13.76 12.3 j 1 live births Perinatal mortality 28.99 25 1 ! per 1,000 Still-births 17.92 14 ] 1 total births](https://iiif.wellcomecollection.org/image/b28861875_0021.jp2/full/800%2C/0/default.jpg)