Volume 1
Census of Scotland, 1911 : report on the twelfth decennial census of Scotland.
- Scotland. Census Office.
- Date:
- 1912-1913
Licence: Public Domain Mark
Credit: Census of Scotland, 1911 : report on the twelfth decennial census of Scotland. Source: Wellcome Collection.
12/724 (page 8)
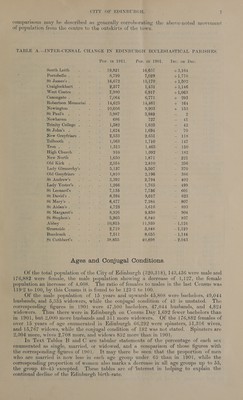
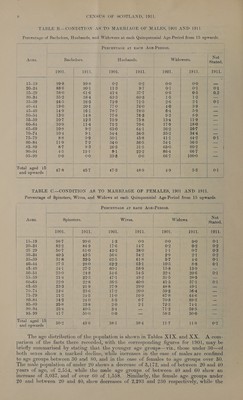
![TABLE B.—CONDITION AS TO MARRIAGE OF MALES, 1901 AND 1911. Percentage of Bachelors, Husbands, and Widowers at each Quinquennial Age-Period from 15 upwards. PERCENTAGE AT EACH AGB-PERIOD. | | | } | | AGES. | Bachelors. | Husbands. Widowers. al A 1901. 1911. 1901. 1911-190) 1911. 1911. | Deere Ee esi: 99-8 0-2 awd 0-2 0-0 0-0 _ 20.04 88-6 90°1 11-3 ced 9-7 0-1 0-1 0-1 ieee 58-0 0016 Bie 4414 Se eg 0:6 0:5 0.2 | 30-84 35:2 38-4 Way 63:3 °° Be 200-8 15 1°3 = | 35-39 24-5 263 72-9 715 2°6 2+] 0-1 40-44 | © 190 20°1 77-0 76-0 4:0 3-9 a0 |, ADO Se eo 16:1 78-7 78-0 6-4 5:9 fae io 0=ba 0 fa) | ea ae) 14-3 ee 7778 76°3 9-2 8:9 ae | 55-59 10-7 19°3 ae. 75-9 75°8 134 11:9 aes | 60-64 10:9 1) :4 a 712” OS ee OG 17-9 18-0 2 | 65-69% . |B 0:8 9-2 63:0. Wed! 64-1 26-2 26:7 ee ire 1O=TA en a et Oe 9+] 544 | 565 35-2 34-4 sie, pec 8:8 9-9 501 | 45:8 41-1 44-2 01 802840 a mate 7:2 34:0 | 865 B41 56°3 = 85-89 | 8:7 8:3 26:3 | 315 65:0. 60:2 = 90-94 | A 11°] 91° | 29-9 86-4 66-7 = 95-99 | 0-0 0-0 33°38 0-0 66-7 100-0 = | | | | ; | pots apes at Oia 45-7 1739 tas 4-9 5-3 O-1 | and upwards TABLE C.—CONDITION AS TO MARRIAGE OF FEMALES, 1901 AND 1911. Percentage of Spinsters, Wives, and Widows at each Quinquennial Age-Period from 15 upwards. PERCENTAGE AT EACH AGE-PERIOD. | 5 5 . | Not | AGES. Spinsters. Wives. Widows. ' Stated. | : -. = oe eee | | 1a yk oon 1911h< io p1901. apy 1911 © 19019 eee oe 1911. - = | | Ly — ze | =, =e bee: = I 15-19 | 98-7 99-0 1:3 | 0-9 | 0-0 0-0 0-1 | 024 ke) 84-9 76k sae ny 0:2 0-2 | 25 29 | 56-7 61-0 49-2 | 38-0 | 11 | 0-7 0:3 30-34 40°5 43:5 56:67) i EPS) Seam 2°9 . 2°] |= 02 35-39 31:8 33°5 | 62:5 | 61:8 5:7 4-6 | Ot 40-44 27°3 28:0 | 62:2 / 63:1 10°5 8:8 0-1 45-49 24+] 27-2 60:1 | 58-9 15:8 13-9 Pe 50-54 23-0 24:8 54-6 / 54-5 29-4 20-6 0-1 55-59 21-4 : 293 471 49-2 31:5 28:5 Bs 60-64 22-0 / 22°8 | 36-5 40-0 AL‘5 37-1 0-1 65-69 23°3 21-9 | 27-9 29-0 48:8 49+] 2m 70-74 236 23-6 17-2 20-0 59:2 56-4 ae 75-79 21:2 24-5 11-0 10-9 67:8 64:6 = 80-84 24:9 24-0 5D 6:7 70:3 69:3 er 85-89 25:8 23:8 2-0 | 2-1 72-2 T41 z. 90-94 25+4 405 | 3:4 | wae Eo 59:5 i | 95-99 | 41:7 50-0 | 0-0 a | 58:3 50-0 = = ips - —————-_| | | $e Total aged 15) 50.9 496° |) egy LS ggg dey gg ie _ and upwards | | The age distribution of the population is shown in Tables XTX. and XX. A. com- parison of the facts there recorded, with the corresponding figures for 1901, may be briefly summarised by stating that the younger age groups—viz., those under 30—of both sexes show a marked decline, while increases in the case of males are confined to age groups between 30 andl 80, and in the case of females to age groups over 30. The male population of under 20 shows a decrease of 3,172, and of between 20 and 40 years of age, of 2,554, while the male age groups of between 40 and 60 show an increase of 3,037, and of over 60 of 1,558. Similarly, the female age groups under 20 and between 20 and 40, show decreases of 2,293 and 230 respectively, while the](https://iiif.wellcomecollection.org/image/b32177264_0001_0012.jp2/full/800%2C/0/default.jpg)