A nutrition survey of the elderly : report by the Panel on Nutrition of the Elderly.
- Great Britain. Panel on Nutrition of the Elderly
- Date:
- 1972
Licence: Open Government Licence
Credit: A nutrition survey of the elderly : report by the Panel on Nutrition of the Elderly. Source: Wellcome Collection.
174/188 (page 156)
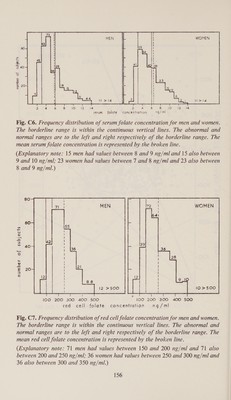
![number of subyects 2 4 6 8 | 10 12 14 2 4 6 8 | 10 12 14 serum folate concentration ng/ml Fig. C6. Frequency distribution of serum folate concentration for men and women. The borderline range is within the continuous vertical lines. The abnormal and normal ranges are to the left and right respectively of the borderline range. The mean serum folate concentration is represented by the broken line. (Explanatory note: 15 men had values between 8 and 9 ng/ml and 15 also between 9 and 10 ng/ml; 23 women had values between 7 and 8 ng/ml and 23 also between 8 and 9 ng/ml.) 80 , 7 MEN 60 BS ISS v Ey —;, b i] 3 42}! + A0- 36 re) i) 2 i 21 —E 20 i = ! | % 12 i 12 >500 1O>500 ! 4 lOO 200 300 400 500 IOO 200 300 400 500 red cell folate concentration ng/ml Fig. C7. Frequency distribution of red cell folate concentration for men and women. The borderline range is within the continuous vertical lines. The abnormal and normal ranges are to the left and right respectively of the borderline range. The mean red cell folate concentration is represented by the broken line. (Explanatory note: 71 men had values between 150 and 200 ng/ml and 71 also between 200 and 250 ng/ml; 36 women had values between 250 and 300 ng/ml and 36 also between 300 and 350 ng/ml.)](https://iiif.wellcomecollection.org/image/b32222488_0174.jp2/full/800%2C/0/default.jpg)