[Report 1948] / Medical Officer of Health, Newport (Gwent) County Borough.
- Newport (Wales). County Council.
- Date:
- 1948
Licence: Attribution 4.0 International (CC BY 4.0)
Credit: [Report 1948] / Medical Officer of Health, Newport (Gwent) County Borough. Source: Wellcome Collection.
10/100 page 8
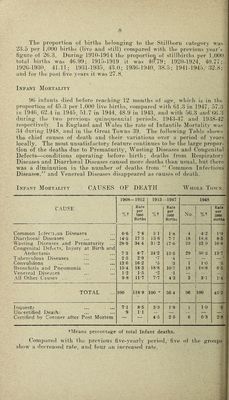
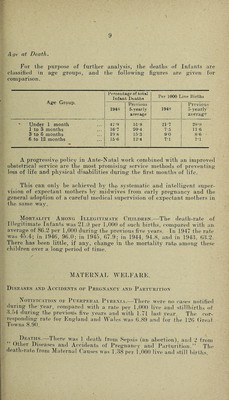
![The proportion of births belonging to the Stillborn category was , '23.5 per 1,000 births (live and still) compared with the i)revions year’s i figure of 26.3. During lOlO-lOld the proportion of stillbirths per 1,000 i total births was 46.99; 1915-1919 it was 41*79; 1920-1924, 40.71;.? 1926-1930, 41.11; 1931-1935, 43.0; 1936-1940, 38.5; 1941-1945, 32.8; ( and for the past five j’ears it was 27.8. ( Infant Mortality 96 infants died before reaching 12 months of ag*e, which is in the 1 proportion of 45.3 per 1,000 live births, compared with 61.3 in 1947, 57.3 in 1946, 62.4 in 1945, 51.7 in 1944, 48.9 in 1943, and with 56.3 and66.3 ' during the two previous quinquennia] periods, 1943-47 and 1938-42-- respectively. In Engdand and Wales the rate of Infa.ntile Mortality was.. 34 during 1948, and in the Great Towns 39. The following Table shows ) the chief causes of death and '.their variations over a period of years., locally. The most unsatisfactory feature continues to be the large propor-*.; tion of the deaths due to Prema,turity, Wasting' Diseases and CongenitaU Defects—conditions operating before birth; deaths from Respiratorv» Diseases and Diarrhoeal Diseases caused more deaths than usual, but there,' was a diminution in the number of deaths from “ Common Infectious^ Diseases,” and Venereal Diseases disappeared as causes of death. ' '< Infant Mort.4lity CAUSES OF DEATH Wholk Toavn.’ CAUSE 1908- -1912 1913 -1947 1948 1 %t Rate per TOOO Births %t Rate per 1000 Births No. %t Rate! per 7 1000 > Births Common Ir.ferUjus Diseases 6-6 7-8 3 1 Is 4 4-2 1'9 ' Diarrhoeal Diseases 14'5 17 3 13-6 7-7 18 18.8 8-6, Wasting Diseases and Prematurity 28-9 34 4 3I-2 17-6 23 23 9 10-81 Congenital Defects, Injury at Birth and Atelectasis 7 3 8-7 24-2 13 6 29 30-2 13-7 Tuberculous Diseases 2-5 2-9 •7 •4 — — - Convulsions 13-6 16-2 ‘5 ‘3 1 1-0 •5 Bronchitis and Pneumonia 15‘4 18 3 18-8 10-7 18 18'8 8 ■'5 Venereal Diseases 1-2 1-5 .O 1 — __ All Other Causes .... 9 8 11-7 7-7 4 3 3 31 1-4V TOTAL 100 118 9 100 • 56 4 96 100 45'3* > Inquests Uncertified Deaths Certified by Coroner after Post Mortem 7-1 •9 8-5 11 3- 3 4- 5 1-8 2-5 1 6 10 6-3 1 . tMeans peicentage of total Infant deaths. Compared with the previous five-yearly period, five of tlie groups show a decreased rate, and four an increased rate. I](https://iiif.wellcomecollection.org/image/b28866897_0012.jp2/full/800%2C/0/default.jpg)