[Report 1948] / Medical Officer of Health, Newport (Gwent) County Borough.
- Newport (Wales). County Council.
- Date:
- 1948
Licence: Attribution 4.0 International (CC BY 4.0)
Credit: [Report 1948] / Medical Officer of Health, Newport (Gwent) County Borough. Source: Wellcome Collection.
8/100 page 6
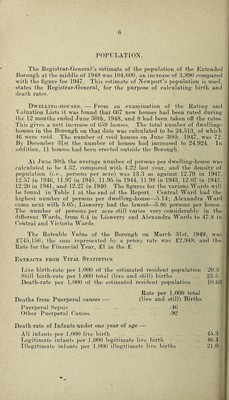
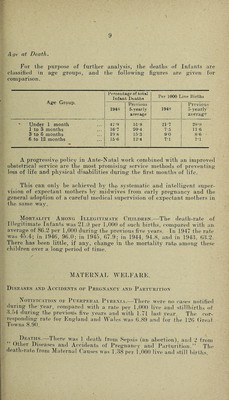
![POPULATION. The Registrar-Greneral’s estimate of the population of the Extended Jioroug’h at the middle of 1948 was 104,600, an increase of 3,890 compared with the figure for 1947. This estimate of Newport’s population is used, states the Registrar-General, for the purpose of calculating hirth and death rates. Dwelling-houses. — From an examination of the Rating and Valuation Lists it was found that 667 new houses had been rated during the 12 months ended June 30th, 1948, and 8 had been taken off the rates. This gives a nett increase of 659 houses. The total number of dwelling- houses in the Borough on that date was calculated to be 24,513, of which 46 were void. The number of void houses on June 30th, 1947, was 72. By December 3Ist the number of houses had increased to 24,924. In addition, 11 houses had been erected outside the Borough. At June 30th the average number of persons per dwelling-house was calculated to be 4.32, compared with 4.22 last .vear, and the density of population {i-e., persons per acre) was 13.3 as against 12.79 in 1947. 12.57 in 194,6, 11.97 in 1945, 11.95 in 1944, 11.98 in 1943, 12.07 in 1942, 12.20 in 1941, a.nd 12.27 in 1940. The figmres for the various Wards will be found in Table 1 at thei end of the Report. Central Ward had the highest number of persons per dwelling-house—5.14; Alexandra Ward came next with 5.05; Liswerry had the lowest—3.86 persons per house. The number of persons per acre still varies very considerably in the different Wards, from 6.4 in Liswerry and Alexandra Wards to 47.8 in Ceiiitral and Victoria Wards. The Rateable Value of the Borough on March 31st, 1949, was £‘745,156; the sum rejireseuted by a jienny rate was £2,948, and the Rate for the Financial Year, £1 in the £. Extracts from Vital Statistics Live birth-ratei per 1,000 of the estimated resident i)opulatioii 20.3 Still birth-rate per 1,000 total (live and still) births ... ... 23.5 Death-rate ])er 1,000 of the estimated re.sident ])opula.tioii ... 10.63 Rate per 1,000 total Deaths from Puerperal causes — (live and still) Births. Puerperal Sepsis ... ... ... ... .4() Other Puerperal CauseK ... ... ... .92 Death-rate of Infants under one year of age — All infants per 1,000 live birth Ijegitimate infants per 1,000 legitimate live birth Illegitimate infants ])er 1,000 illegitimate live births 45.3 46.4 21.0](https://iiif.wellcomecollection.org/image/b28866897_0010.jp2/full/800%2C/0/default.jpg)