The rate of mortality in Manchester, and other manufacturing towns, compared with that of cathedral and county towns / by James Whitehead.
- James Whitehead
- Date:
- 1864
Licence: Public Domain Mark
Credit: The rate of mortality in Manchester, and other manufacturing towns, compared with that of cathedral and county towns / by James Whitehead. Source: Wellcome Collection.
Provider: This material has been provided by The Royal College of Surgeons of England. The original may be consulted at The Royal College of Surgeons of England.
87/94 (page 67)
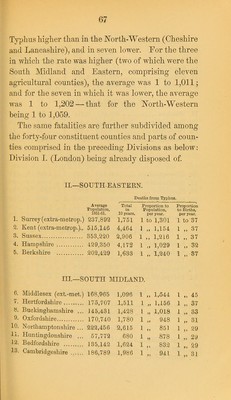
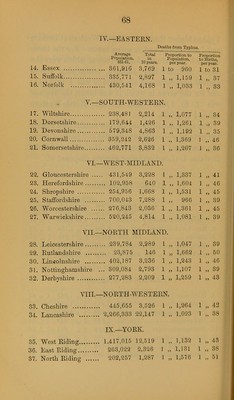
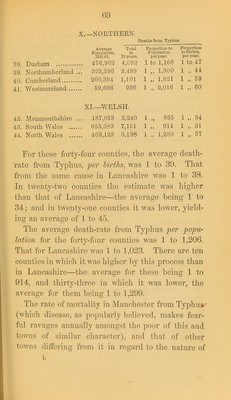
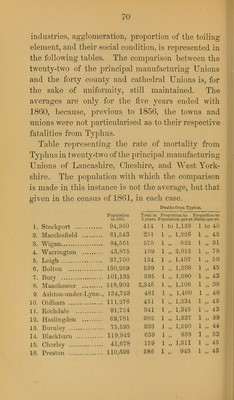
![Typhus higher than in the North-Western (Cheshire and Lancashire), and in seven lower. For the three in which the rate was higher (two of which were the South Midland and Eastern, comprising eleven agricultural counties), the average was 1 to 1,011; and for the seven in which it tvas lower, the average was 1 to 1,202 — that for the North-Western being 1 to 1,059. The same fatalities are further subdivided among the forty-four constituent counties and parts of coun- ties comprised in the preceding Divisions as below: Division I. (London) being already disposed of. II.—SOUTH-EASTERN. Deaths from Typhus. Average Total Proportion to Proportion Population, in Population, to Births, 1851-61. 10 years. per year. per year. 1. Surrey (extra-metrop.) 237,892 1,751 1 to 1,301 1 to 37 2. Kent (extra-metrop.).. 515,146 4,464 1 „ 1,154 1 „ 37 3. Sussex 353,220 2,906 1 „ 1,216 1 „ 37 4. Hampshire 429,350 4,172 1 „ 1,029 1 „ 32 5. Berkshire 202,429 1,633 1 „ 1,240 t- CO T—i III.—SOUTH MIDLAND. 6. Middlesex (ext.-met.) 108,965 1,096 1 „ 1,544 1 „ 45 7. Hertfordshire 175,707 1,511 1 „ 1,156 1 „ 37 8. Buckinghamshire ... J 45,431 1,428 1 1,018 1 „ 33 9. Oxfordshire 170,740 1,780 1 „ 948 1 „ 31 10. Northamptonshire ... 222,450 2,015 1 „ 851 1 „ 29 11. Huntingdonshire ... 67,772 680 1 878 1 29 12. Bedfordshire . 135,142 1,624 1 „ 832 1 „ 29 13. Cambridgeshire 186,789 1,986 1 „ 941 1 „ 3]](https://iiif.wellcomecollection.org/image/b22337556_0089.jp2/full/800%2C/0/default.jpg)