The rate of mortality in Manchester, and other manufacturing towns, compared with that of cathedral and county towns / by James Whitehead.
- James Whitehead
- Date:
- 1864
Licence: Public Domain Mark
Credit: The rate of mortality in Manchester, and other manufacturing towns, compared with that of cathedral and county towns / by James Whitehead. Source: Wellcome Collection.
Provider: This material has been provided by The Royal College of Surgeons of England. The original may be consulted at The Royal College of Surgeons of England.
88/94 (page 68)
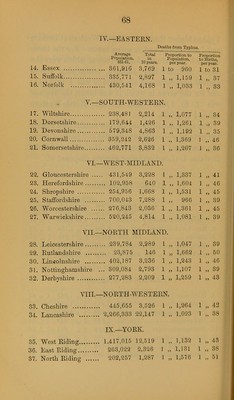
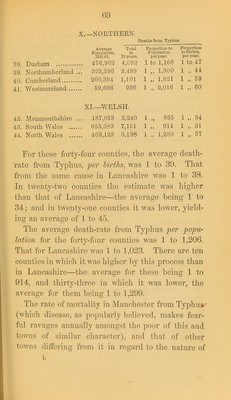
![IV.— EASTERN. Deaths from Typhus. 14. Essex Average Population 851-61. Total in 10 years. 3,769 Proportion to Population, per year. 1 to 900 Proportion to Births, per year. 1 to 31 15. Suffolk 385,771 2,897 1 „ 1,159 1 „ 37 16. Norfolk 4,168 1 „ 1,033 1 „ 33 V.—SOUTH-WESTERN. 17. Wiltshire 238,481 2,214 1 „ 1,077 1 „ 34 18. Dorsetshire 179,644 1,426 1 „ 1,261 1 „ 39 19. Devonshire 579,348 4,863 1 „ 1,192 1 „ 35 20. Cornwall 359,242 2,626 1 „ 1,369 ] ,, 46 21. Somersetshire 462,771 3,832 1 „ 1,207 1 „ 36 VI.—WEST-MIDLAND. 22. Gloucestershire 431,549 3,228 1 „ 1,337 1 „ 41 23. Herefordshire 102,958 640 1 ,, 1,604 1 ,, 46 24. Shropshire 254,956 1,668 1 ,, 1,531 1 ,, 45 25. Staffordshire 700,043 7,288 1 ,, 966 1 ,, 39 26. Worcestershire 276,843 2,036 1 ,, 1,361 1 ,, 45 27. Warwickshire 520,245 4,814 1 ,, 1,081 1 ,, 39 VII. —NORTH MIDLAND. 28. Leicestershire 239,784 2,289 1 ,, 1,047 1 „ 39 29. Rutlandshire 23,875 146 1 „ 1,662 1 ,, 50 30. Lincolnshire 402,187 8,236 1 ,, 1,243 1 ,, 46 31. Nottinghamshire ... 309,084 2,798 1 ,, 1,107 1 ,, 39 32. Derbyshire 277,283 2,209 1 „ 1,259 1 „ 43 VIII. —N ORTH-WE STERN. 33. Cheshire 445,655 3,520 1 „ 1,264 1 „ 42 34. Lancashire 2,260,333 22,147 1 „ 1,023 1 „ 38 IX.—YORK. 35. West Riding 1,417,015 12,519 1 „ 1,132 1 „ 43 36. East Riding 263,022 2,326 J ,, 1,131 1 ,, 38 37. North Riding 202,257 1,287 1 „ 1,576 1 ,, 51](https://iiif.wellcomecollection.org/image/b22337556_0090.jp2/full/800%2C/0/default.jpg)