[Report 1913] / Medical Officer of Health, Salop / Shropshire County Council.
- Shropshire (England). County Council.
- Date:
- 1913
Licence: Attribution 4.0 International (CC BY 4.0)
Credit: [Report 1913] / Medical Officer of Health, Salop / Shropshire County Council. Source: Wellcome Collection.
9/160 (page 7)
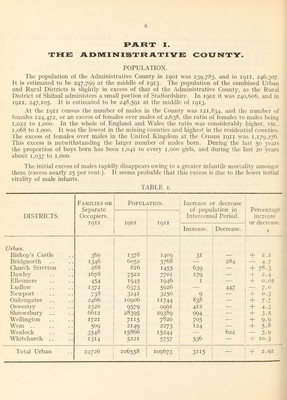
![I. STATISTICS FOR 1913 Urban Districts. Bishop’s Castle Bridgnorth Church Stretton Dawley Ellesmere Ludlow .. Newport Oakengates Oswestry.. Shrewsbury Wellington Wem Wenlock Whitchurch Births. Estimated population in 1913 ifpon which the rates are calculated. 1410 5768 1530 7740 1960 5850 3250 11904 10000 29627 7990 2306 15160 5850 Whole of Urban Districts 110386 Whole of Urban and Rural Districts 248591 Un¬ corrected Number 23 116 24 234 44 105 59 284 212 607 184 58 306 111 Nett. Number 21 115 24 237 43 105 57 285 214 615 178 58 304 111 236'] 5245 Rate. 14.9 19.9 15.7 30.6 21.9 17.9 17.5 23.9 21.4 20.7 22.2 25.1 20.0 19.0 Total Deaths Registered in the District. Number 21.4 27 71 18 75 38 85 39 124 128 410 106 27 191 81 Rate. 1420 21.1 2996 19.1 12.3 11.8 9.7 19.3 14.5 12.0 10.4 12.8 13.8 13.3 11.7 12.6 13.8 12.8 12.0 Transferable Deaths. of Non¬ residents regis¬ tered in the District. 2 7 6 20 10 8 3 72 17 3 13 11 172 287 of Resi¬ dents no regis¬ tered in the District. 3 6 2 8 3 9 4 11 27 53 16 1 7 1 151 303 Rural Districts. Atcham .. 21000 452 445 21.2 305 14.5 86 17 31 69 236 11.2 .80 .0 Bridgnorth 9140 • • 212 23.1 95 10.3 . . 7 13 61 102 11.1 . 10 .43 Burford .. 1323 26 27 20.4 14 10.6 3 2 1 37 13 9.8 1.51 1.51 Chirbury 3304 50 50 15.1 42 12.7 « • 1 3 60 43 13.0 1.21 .30 Church Stretton 4840 83 84 17.4 45 9.3 • . 5 7 83 50 10.3 .20 .0 Cleobury Mortimer 7150 171 171 23.9 71 9.9 1 8 11 64 78 10.9 . 13 .41 Clun 6520 138 139 21.2 56 8.6 • • 6 8 57 62 9.5 .92 .30 Drayton 12480 242 241 19.3 158 12.6 1 4 18 75 161 12.9 .40 . 16 Ellesmere 8488 165 165 19.4 88 10.3 •• 18 12 72 106 12.4 .0 . 35 Ludlow .. 9409 214 218 23.1 91 9.7 1 15 13 59 105 11.1 .21 .21 Newport 5990 125 125 20.8 65 10.8 1 14 17 136 78 13.0 .33 .16 Oswestry.. 15500 367 364 23.4 204 13.1 19 10 25 68 195 12.5 .45 .19 Shifnal 8976 164 163 18.1 99 11.0 3 7 11 67 103 11.4 .66 Teme 1644 31 32 19.4 22 13.3 • • 2 3 93 24 14.5 .60 1.21 Wellington 11091 223 20.1 107 9.6 • • 19 18 80 126 11.4 .63 .0 Wem 8373 180 180 21.5 96 11.4 • . 14 13 72 110 13.1 .47 .23 Whitchurch 1945 39 39 20.0 18 9.3 3 1 26 21 10.8 .0 .0 Whole of Rural Districts 138205 2878 20.8 1576 11.4 115 152 205 71 1613 11.6 .47 .21 Whole of Urban and Rural Districts 248591 5245 21.1 2996 12.0 287 303 390 74 3012 12.1 .58 .21 Nett Deaths belonging to the District. ! Death-rates from Various Causes. Under 1 year At all Ages. | t ot Age. Other Organic Pneu- Diarr- 1 Neph- Phthisis. Tuber- Cancer. Heart Bron- monia. hoea ritis Rate per culous Disease. chitis. (all and and Number 1000 Number Rate. Diseases forms). ; Enter- Bright’s Nett itis. Disease. Births. 1 48 28 19.8 1.42 .70 .70 4.25 .70 2.13 .0 .0 12 104 70 12.1 1.04 .17 .86 .52 1.04 1.38 .34 .34 1 42 14 9.1 .65 . 65 .0 . 65 .0 1.30 .0 .0 17 72 83 10.7 .77 .13 1.03 1.03 .64 1.16 .13 .51 0 0 21 10.7 .0 .0 1.02 2.55 .51 1.53 .0 1.02 4 38 84 14.3 1.19 .51 1.02 1.53 . 85 .68 .0 . 85 2 35 35 10.8 1.53 .0 1.23 1.53 1.23 .30 .0 .0 27 94 135 11.3 .42 . 25 1.34 1.34 1.51 .67 . 75 .17 19 88 152 15.2 .70 .50 1.90 2.20 .50 1.70 .0 1.60 46 74 391 13.1 .77 .17 1.55 1.14 1.38 .87 .40 .40 14 78 105 13.1 .37 .12 .62 1.00 1.25 . 75 .50 .87 4 68 25 10.8 .0 .0 .86 .0 .86 1.73 .0 .0 23 76 185 12.2 .79 .13 .92 1.91 .92 .92 .13 .46 15 135 71 12.1 .51 .17 . 85 1.88 .17 .85 .34 .68 185 78 1399 12.7 .72 .22 1.20 1.42 1.02 .99 .29 . 55 390 74 3012 12.1 .58 .21 1.18 1.55 .89 .78 .26 . 45 1.46 1.20 2.26 1.21 .82 .97 1.07 1.76 1.41 .63 . 50 .90 1.00 .60 1.35 1.43 .51 1.71 1.53 1.51 1.51 1.44 1.67 1.22 2.08 2.12 1.48 1.66 1.67 1.33 .60 .71 .43 .0 1.21 1.44 1.25 .92 .80 .70 .42 1.33 .71 . 77 1.82 .07 .43 . 75 .60 .41 .55 .61 .32 .47 .63 .33 .96 .66 .0 .28 ,32 .0 .0 .0 .27 .0 ,24 11 10 .83 25 11 ,0 .23 .21 .0 .60 .0 .41 .46 .32 . 3d .63 .50 .51 .44 .0 1.1' 1.18 1.98 1.55 1.02 .81 .47 1.54 1.26 . 35 .51 .36 .47 .0 .36 .23 1.02 1.65 .79 .60 .24 .37 1.55 .89 .78 .26 ' — < .45](https://iiif.wellcomecollection.org/image/b30086516_0011.jp2/full/800%2C/0/default.jpg)