Women in science and technology equal opportunity act, 1980 : hearing before the Subcommittee on Health and Scientific Research of the Committee on Labor and Human Resources, United States Senate, Ninety-sixth Congress, second session, on S. 568 ... March 3, 1980.
- United States. Congress. Senate. Committee on Labor and Human Resources. Subcommittee on Health and Scientific Research.
- Date:
- 1980
Licence: Public Domain Mark
Credit: Women in science and technology equal opportunity act, 1980 : hearing before the Subcommittee on Health and Scientific Research of the Committee on Labor and Human Resources, United States Senate, Ninety-sixth Congress, second session, on S. 568 ... March 3, 1980. Source: Wellcome Collection.
237/240 (page 233)
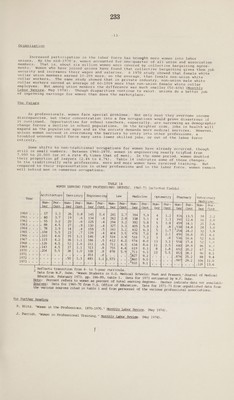
![See Organization Increased participation in the labor force has brought more women into labor unions. By the mid-1970's, women accounted for one-guarter of all union and association members. That is, about six million women were covered by collective bargaining agree- ments. Women who have joined unions have found that collective bargaining gives them job security and increases their wages and salaries. A 1970 study showed that female white collar union members earned 10-20% more, on the average, than female non-union white collar workers. The same study showed that in Private industry, non-union male white collar workers earned an average of 60-100% more than non-union female white collar employees. But .among union members the difference was much smaller (50-60%) (Monthly Labor Review, May 1974). Though disparities continue to exist, unions do a better job of improving earnings for women than does the marketplace. The Future As professionals, women face special problems. Not only must they overcome income discrepancies, but their concentration into a few Occupations would prove disastrous if it continued. Opportunities for school teachers, especially, are narrowing as demographic change forces a decline in school populations. On the brighter side, jobs in health will expand as the population ages and as the society demands more medical services. However, unless women succeed in overcoming the barriers to entry into other professions, a troubled economy could force many into lower skilled jobs, or out of the labor force entirely. Some shifts to non-traditional occupations for women have already occurred, though still in small numbers. Between 1960-1970, women in engineering nearly tripled from 7,000 to 20,000 (or at a rate 44 times that of men). In the same period, women doubled their proportion of lawyers (2.4% to 4.7%). Table 14 indicates some of those changes. In the traditionally male professions, more and more women have received training. But compared to their representation in other professions and in the labor force, women remain well behind men in numerous occupations. TABLE 14 WOMEN EARNING FIRST PROFESSIONAL DEGREES, 1960-73 (selected fields) Architecture] Dentistry | Engineering Law Medicine Optometry | Pharmacy | Veterinary Year ee (ies | Medicine ent Cent |_ ber | Cent | ber |Cent} ber | Cent ber | Cent | ber! Cent | ber Cent __ 1IGOM cr tscrs 55) O28) 245,10 O24 PEG) 5.9 4 eee 355 USE|) ea ESGPSSas Sioif -6 134 -4 Za8 Diet 4 31.58} 12.6 16 2.0 19622 ae 302 SS) | RAS -4 322 5.8 5 1.8 14.1 2 26 UCSC elec 4.5 130 -4 333 529 3 -8 14.8 24) 3.0 LIGA. se 3.9 159 75 2.2 6.3 5 Lay, 24.2 32) 3.9 LOGS s-2s S35 139 74 SoS) HO) 8 Drak 16.6 35 ae OGG. sasomrs 4.6 146 -4 3.9 Uo 3 -8 16.6 5271) 6a) U967)*. ie 4.2 186 65) 4.2 8.0 | 13 Sal 17.4 yD Ihe EN 1968) 2 = 4.5 211 -6 4.3 SeGn | gull 2.5 18.9 86} &.7 1969.) Zs. 313 -8 4.4 823 8 1.8 20.2 67] 6.2 1O7O) as 5.5 -8 529 a | P83 555 28.1 S10) |] oil EOI = Bars Bt: Sa A OFZ 252 88] 9.4 HOI? 5 ee Nei) he Sis) SEOWR. Sit 3 29.2 | 106] 11.0 OYE! oe 6 staat F OE i erets : : - 12651) 1356 : Reflects transition from 4— to 5-year curricula. Data from W.F. Dube, Women Students in U.S. Medical Schools: Past and Present, Journal of Medica] Education, February 1973, pp. 186-89, table 1. Data for 1973 estimated by W.F. Dube. Note: Percent refers to wamen as percent of total earning degrees. Dashes indicate data not available Sources: Data for 1960-70 fram U.S. Office of Education. Date for 1971-73 fram unpublished data fram the various sources cited in table 1 and fran personnel of the various professional associations. For Further Reading R. Blitz, Women in the Professions, 1870-1970, Monthly Labor Review, (May 1974) . J. Parrish, Women in Professional Training, Monthly Labor Review, (May 1974).](https://iiif.wellcomecollection.org/image/b32221447_0237.jp2/full/800%2C/0/default.jpg)