Report of the Medical Officer of Health on the public health and sanitary circumstances of Johannesburg.
- Johannesburg (South Africa)
- Date:
- [1930]
Licence: Public Domain Mark
Credit: Report of the Medical Officer of Health on the public health and sanitary circumstances of Johannesburg. Source: Wellcome Collection.
10/32 (page 8)
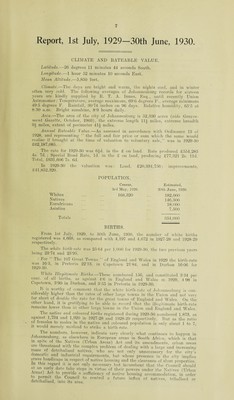
![DEATHS AND DEATH-RATES. The deaths herein referred to are those of persons who died within the extended Municipal Area as defined by proclamations 13 of 1902 and 46 of 1903:— Deaths. Year Whites Natives Eurafricans Asiatics All Persons 1910-11 1,493 3,108 229 99 4,929 1911-12 1,505 2,683 270 80 4,538 1912-13 1,411 2,907 229 103 4,650 1913-14 1,204 1,706 208 89 3,207 1914-15 1,453 1,890 296 107 3,746 1915-16 1,338 2,095 227 85 3,745 1916-17 1,852 2,061 324 132 4,369 1917-18 1,661 1,737 273 118 3,789 1918-19 2,261 2,843 447 263 5,814 1919-20 1,632 2,110 303 126 4,171 1920-21 1,710 2,194 373 114 4,391 1921-22 1,758 1,891 330 145 4,124 1922-23 1,610 1,994 319 111 4,034 1923-24 1,562 2,314 321 143 4,340 1924-25 1,568 2,213 345 142 4,268 1925-26 1,600 2,238 309 114 4,261 1926-27 1,801 2,621 354 139 4,915 1927-28 1,858 2,696 440 137 5,131 1928-29 1,989 2.795 304 143 5,231 1929-30 1,942 3,115 339 172 5,568 Death-Rates. DEATH- RATES (excluding non-residents) Wl Gross rite ^Corrected for Age and Sex distrib. Natives Eur¬ africans Asiatics All Persons 1910-11 133 15-2976 33-6 31T 19-7 23-4 1911-12 11-6 13-3423 25-5 24-4 18-9 1912-13 10-52 12-10 27-63 23-21 18-68 1913-14 8-98 10-32 16-34 21-19 12-66 1914-15 10-84 t 18-00 28-11 14-39 1915-16 9-55 — 19-95 21-81 14-32 1916-17 12-04 — 16-73 23-21 14-69 1917-18 10-55 — 14-14 20 •25 12-69 1918-19 16-06 — 26-94 38-15 21-94 1919-20 10-88 — 17-58 27-54 25-20 14-58 1920-21 11-07 — 17-90 33-86 21-07 14-96 1921-22 10-98 — 17-19 29-96 • 26-80 14-39 1922-23 10-06 — 16-43 29-25 20-72 13-55 1923-24 9-76 — 19-06 29-43 26-70 14-61 1924-25 9-31 — 17-75 28-53 23-90 13-72 1925-26 9-50 — 17-95 25-56 19-19 13-70 1926-27 10-46 — 18-77 27-57 22-78 14-85 1927-28 10-50 — 18-52 3M6 21-39 14-96 1928-29 11-05 —_ 19-07 17-88 20-42 14-92 1929-30 10-67 21-62 18-83 22-93 15-72 * Factor for correction U502. + No factor available. Death-Rate in British, Colonial and Foreign Cities. Appended, for purposes of comparison, are particulars as to the “ Death-rate per 1,000 from All Causes ” in large cities in other parts of the world:— Greater London (i.e., Metro- JOHANNESBURG— politan and City Police Whites 10-67 (] 929-301 Districts) ... 14-2 (1929) Natives 21-62 “ Great Towns ” of England Eurafricans J8*83 jj and Wales 13-4 3 3 Asiatics 22-93 „ East London ... 8-8 (1929-30) All Persons 15-72 „ Durban 8-83 3 3 Kimberley 1 P6 : 3 Bloemfontein 7-5 3 3 Capetown 1067 3 3 Pretoria ... A- 7-26 3 3 Pietermaritzburg 8-3 3 3 Except in regard to South African towns, these figures are taken from the Statistical Review of the Registrar-General for England and Wales, 1929. Whilst the mortality rate for Natives in the year under review is higher than it has been in the last ten years, it will be noted that the mortality rate for Eurafricans and Asiatics is less than the average for the past ten years, and that the European rate is as low as it has been in the last four years, despite Ihe so-called economic depression existing. The rate is considerably lower than that of the Great Towns of England and Wales.](https://iiif.wellcomecollection.org/image/b3148797x_0010.jp2/full/800%2C/0/default.jpg)