[Report 1938] / Medical Officer of Health, Littlehampton U.D.C.
- Littlehampton (England). Urban District Council.
- Date:
- 1938
Licence: Attribution 4.0 International (CC BY 4.0)
Credit: [Report 1938] / Medical Officer of Health, Littlehampton U.D.C. Source: Wellcome Collection.
29/38 (page 27)
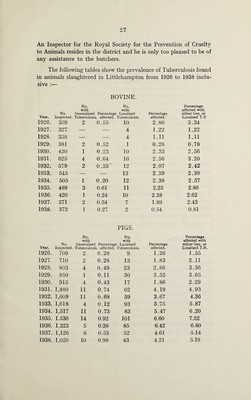
![An Inspector for the Royal Society for the Prevention of Cruelty to Animals resides in the district and he is only too pleased to be of any assistance to the butchers. The following tables show the prevalence of Tuberculosis found in animals slaughtered in Littlehampton from 1926 to 1938 inclu¬ sive :— BOVINE. Year. No. with No. Generalised Percentage Inspected. Tuberculosis, affected. No. with Localised Tuberculosis. Percentage affected. Percentage affected with either Gen. or Localised T.B 1926. 359 2 0.55 10 2.80 3.34 1927. 327 — — 4 1.22 1.22 1928. 358 — — 4 1.11 1.11 1929. 381 2 0.52 1 0.26 0.78 1930. 430 1 0.23 10 2.33 2.56 1931. 625 4 0.64 16 2.56 3.20 1932. 579 2 0.35' 12 2.07 2.42 1933. 545 — — 13 2.39 2.39 1934. 505 1 0.20 12 2.38 2.57 1935. 489 3 0.61 11 2.25 2.86 1936. 420 ] 0.24 10 2.38 2.62 1937. 371 2 0.54 7 1.89 2.43 1938. 373 1 0.27 2 0.54 0.81 PIGS. Year. No. with No. Generalised Percentage Inspected. Tuberculosis, affected. No. with : Localised Tuberculosis. Percentage affected. Percentage affected with either Gen. or Localised T.B. 1926. 709 2 0.28 9 1.26 1.55 1927. 710 0.28 13 1.83 2.11 1928. 803 4 0.49 23 2.86 3.36 1929. 850 1 0.11 30 3.52 3.65 1930. 915 4 0.43 17 1.86 2.29 1931. 1,480 11 0.74 62 4.19 4.93 1932. 1,609 11 0.68 59 3.67 4.36 1933. 1,618 4 0.12 93 5.75 5.87 1934. 1,517 11 0.73 83 5.47 6.20 1935. 1.530 14 0.92 101 6.60 7.52 1936. 1,323 5 0.38 85 6.42 6.80 1937. 1,126 6 0.53 52 4.61 5.14 1938. 1,020 10 0.98 43 4.21 5.19](https://iiif.wellcomecollection.org/image/b29736614_0029.jp2/full/800%2C/0/default.jpg)